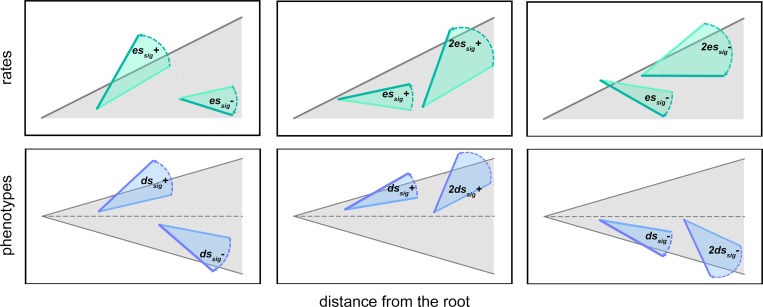
Fig 4. Illustration of the simulation experiments performed to test the power of search.trend function to correctly identify clades evolving at different regimes from the rest of the tree.
The gray shaded area represent the idealized distribution of phenotypes and rates according to the Brownian motion model of evolution. In the simulations, individual clades are selected and then transformed by imposing a distinctive phenotypic rate regime (upper row) or phenotypic mean change regime (lower row).

