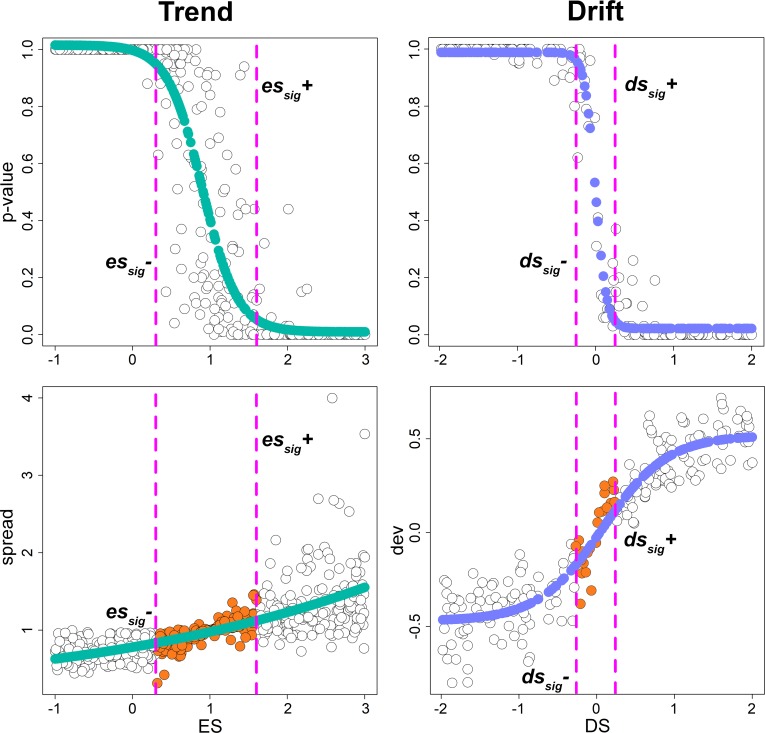
Fig 5.
Upper row, the relationship between the intensity of the simulated phenotypic pattern (obtained applying the es and ds transforms) and the power of search.trend. Lower row, the effect of the ds and es transforms on the original (untransformed) Brownian motion phenotype. For the phenotypic drift (lower row, right) we plotted the standard phenotypic deviation (dev) from the root at dssig (i.e. at ds = 0.25 and ds = -0.25). For the rate trend (lower row, left), we plotted the spread metrics after applying the es transform at essig (orange full dots, es = 0.3 and 1.6). The orange dots represent the values of es or ds either where search.trend finds no significant differences from Brownian motion.

