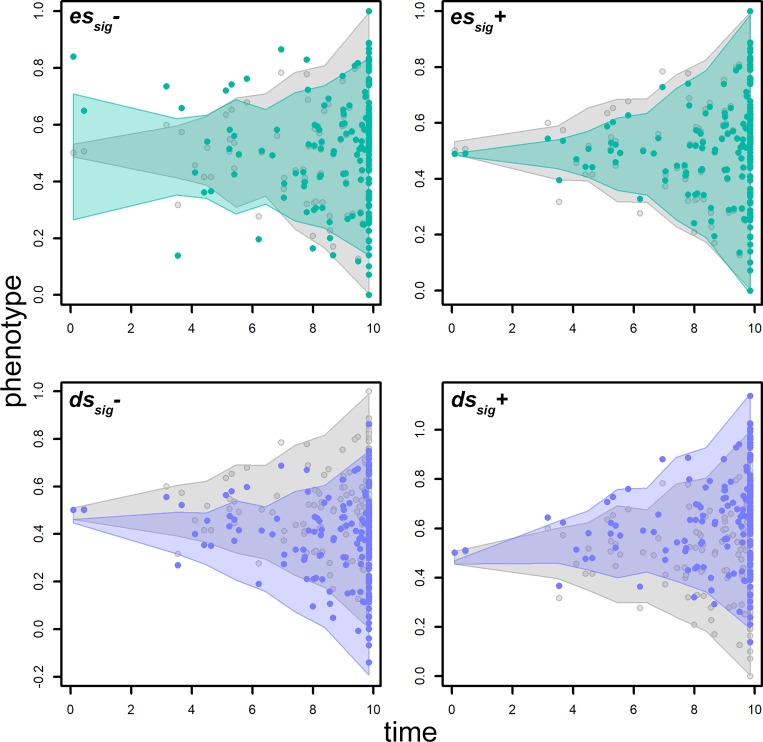
Fig 6. The change in phenotypic values occurring by transforming a Brownian motion generated phenotype (gray dots) by applying a trend in the rate of evolution (upper row, green dots) or a drift to the phenotypic mean (lower row, purple dots).
The shaded areas represent the distribution of values generated after 100 random iterations. The gray shaded area represents the distribution of Brownian motion simulations. The green shaded area represents the distribution of trend-ed phenotypes. At essig- the phenotype is simulated according to a declining rate of phenotypic evolution. On the opposite, the rate increases at essig+ (right upper corner). At dssig- the phenotypic mean becomes smaller over time (left lower corner), the opposite applies at dssig+ (right lower corner).

