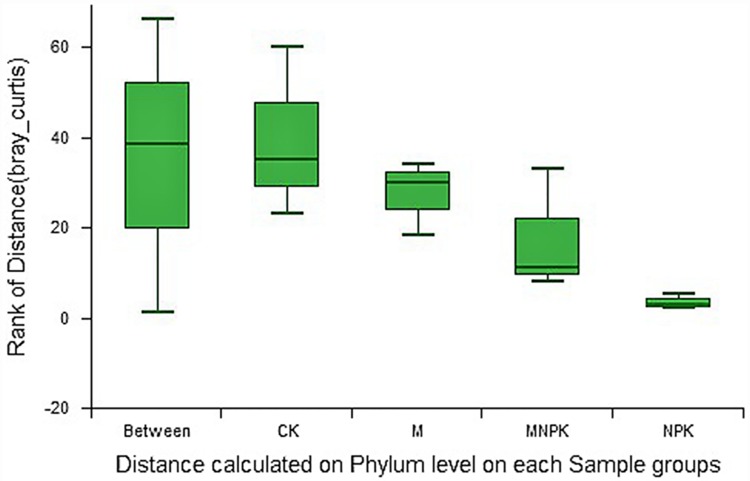
Fig 2. Analysis of similarities under different treatments at the Phylum level.
The distance along the x-axis is the rank of distance value within or between groups. “Between” represents the distance value of the difference between the groups; group names represent the difference distance value within each group. The Y-axis represents the Bray-Curtis dissimilarity.

