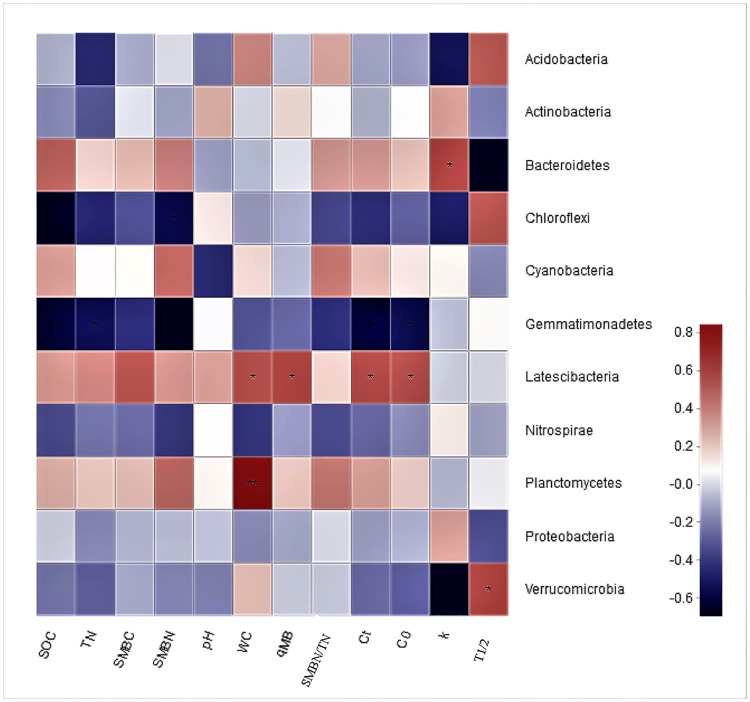
Fig 5. Pearson correlation heatmap of microbes and environmental variables and mineralization parameters.
The X-axis and Y-axis represent the environmental factors and bacterial species, respectively. Color variations reflect positive (red) or negative (blue) correlation and the color depth indicates the level of positive or negative correlation, i.e. the darker the color, the better the correlation, as shown by the scale on the right. A P value less than 0.05 is denoted with *, a P value less than 0.01 is denoted with **.

