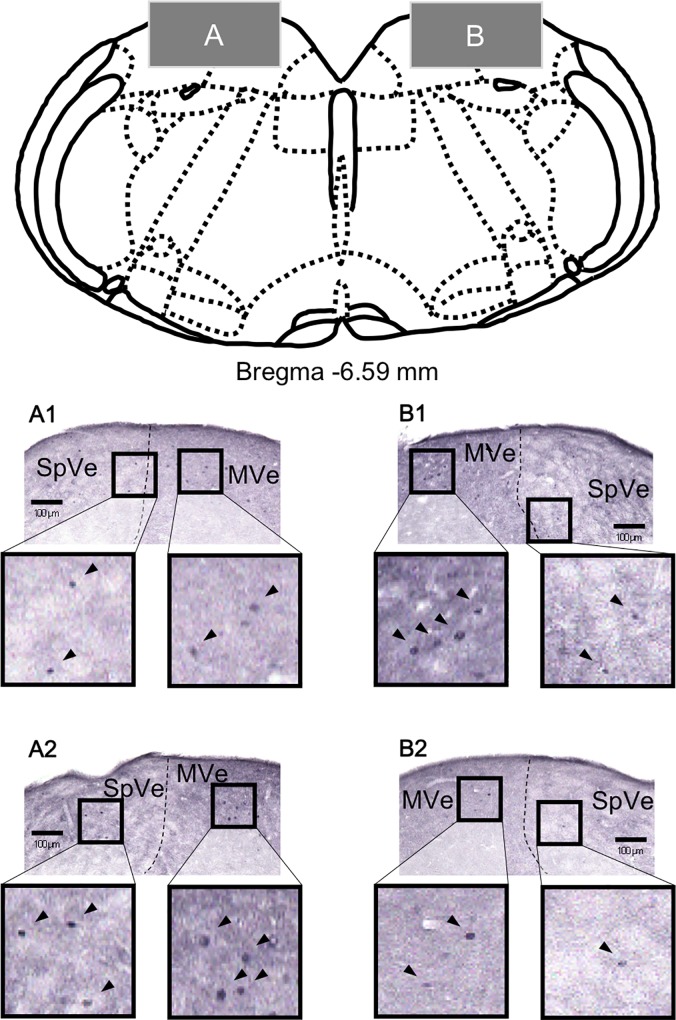
Fig 3.
Photomicrographs of the spinal vestibular nucleus (SpVe) and medial vestibular nucleus (MVe) (A: left and B: right) in male mice 2 h after low-pressure exposure (A1 and B1) and under control conditions (A2 and B2). Arrowheads indicate c-Fos-positive cells. The histological sections are shown as gray squares in the schematic drawing of the medulla oblongata (upper panel).

