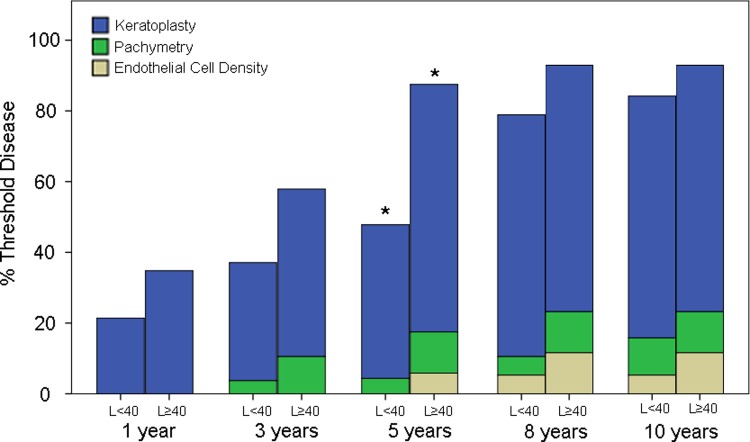
Fig 2. Threshold disease progression.
Percentage of patients who had reached Threshold Disease, for L≥40 vs L<40 groups, by each time point. At each time point, patients are further sub-classified as having reached threshold based on the indication for keratoplasty, fulfilment of the pachymetry criteria or fulfilment of the endothelial cell density criteria. *Statistically significant difference in Threshold Disease proportions between L≥40 and L<40 groups, at 5-years (p = 0.012). There were no statistically significant differences in Threshold Disease proportions between the 2 groups at the 1-year (p = 0.227), 3-year (p = 0.065), 8-year (p = 0.278) or 10-year (p = 0.426) time-points.

