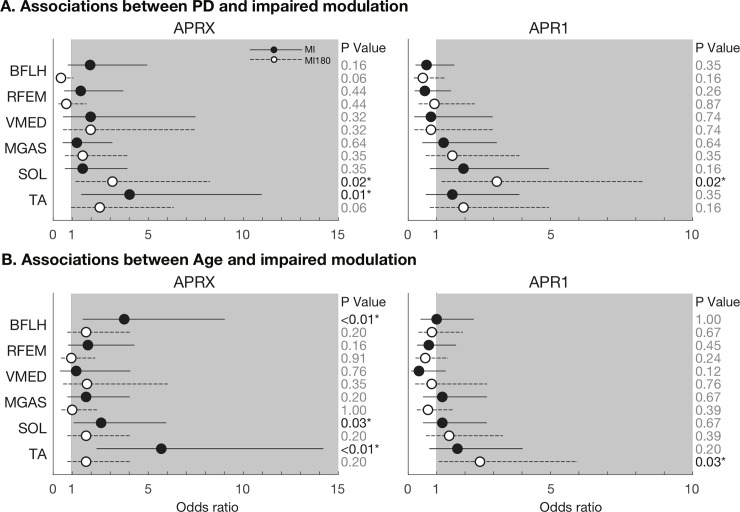
Fig 2.
Associations between PD (A) and Age (B) and impaired modulation in analyses of individual muscles. Associations are described as Odds Ratios (OR) calculated separately using both MI and MI180 modulation indices derived from both APR1 and APRX time bins. Solid lines and dots represent the OR and 95% confidence limits for modulation index MI; dashed lines and open dots represent modulation index MI180. Odds ratios > 1 (shaded area) indicate that the presence of the risk factor (PD or Age) is strongly associated with the presence of impaired modulation for that muscle.

