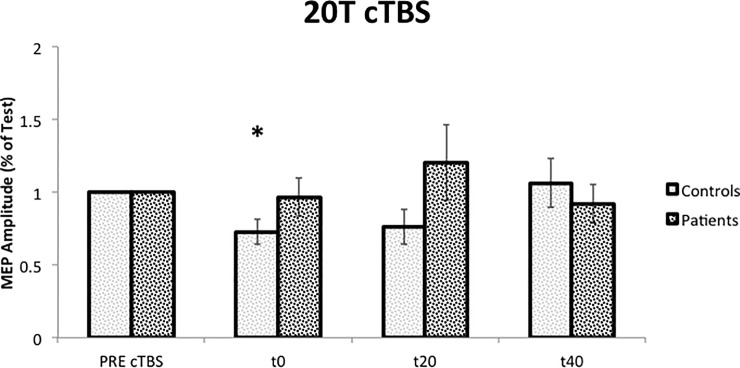
Fig 4. Effects of cerebellar cTBS on cortical excitability (MEP protocol).
20T: 20 Test. PRE: before cTBS; t0: immediately after cTBS; t20: 20 minutes after cTBS; t40: 40 minutes after cTBS. *: P < 0.05 (difference, in control group, compared to the value obtained before the cTBS). Error bars represent the standard error.

