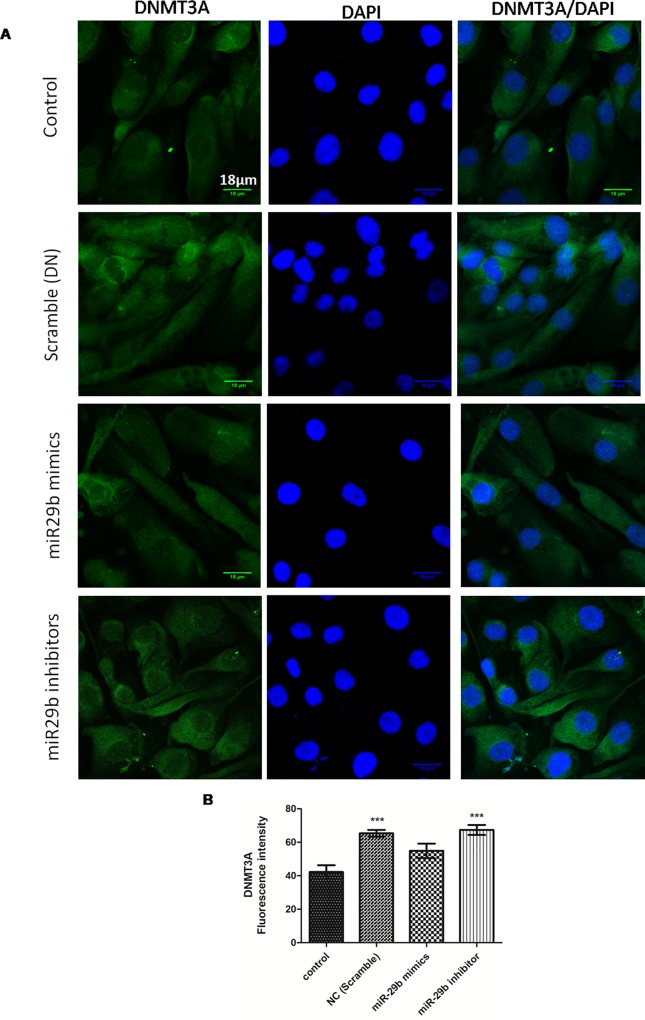
Fig 8. Effect of miR-29b mimics and inhibitor on expression profile of DNMT3A in DN model.
A and B: Immunofluorescence microscopy as well as quantitative analysis shows that transfection with miR29b mimics attenuated DNMT3A expression level while transfection with miR29b inhibitors showed elevated expression levels of DNMT3A. Scale bar, 18μm. Representative (n = 5), *indicates ‘p’ value <0.05, ** indicates ‘p’ value < 0.01, *** indicate p value <0.001.

