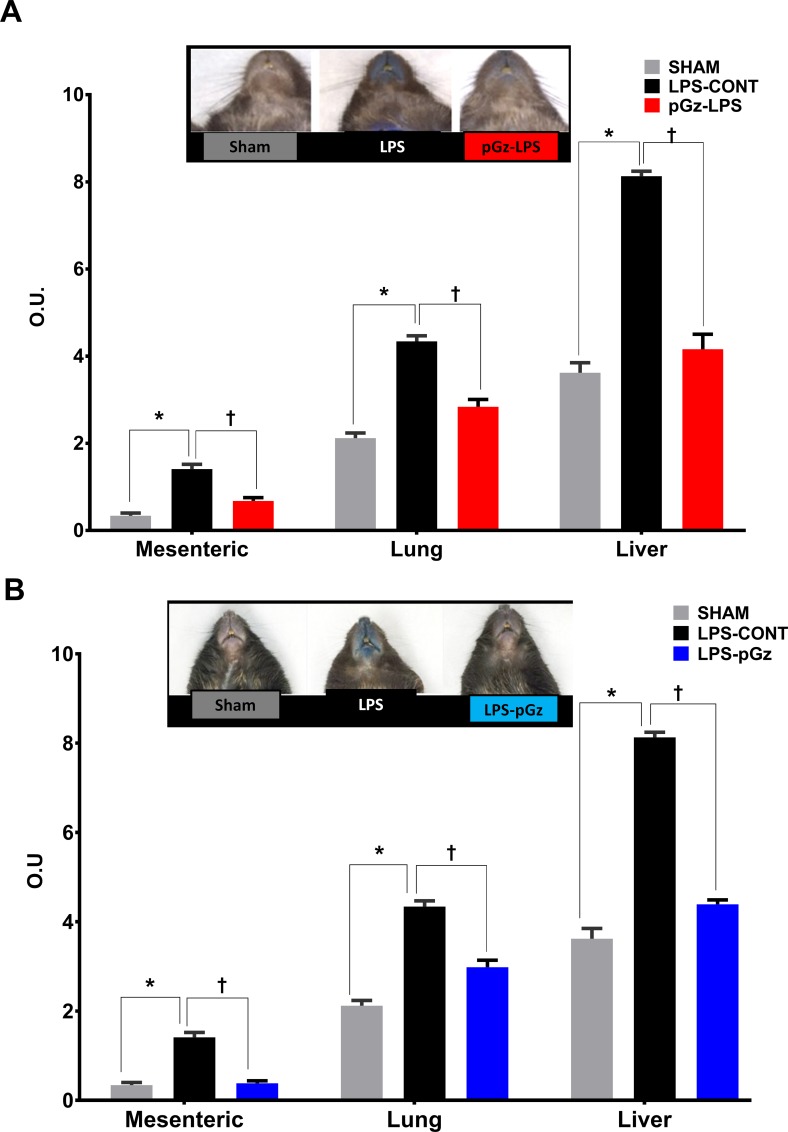
Fig 2. Microvascular leakage after LPS in mesenteric, lung and liver vasculature.
Mesenteric, lung and liver microvascular leakage determined by spectrophotometric optical density (OD) of Evans Blue, in Sham, LPS-CONT and pGz pretreated (pGz-LPS) (A) and (B) post-treated mice (LPS-pGz) mice. LPS-CONT (n = 8) pGz-LPS (n = 8), LPS-pGz (n = 8), or Sham (received Evans Blue but did not received LPS or pGz, n = 4). Data are mean ± SEM. (* p<0.01 vs. Sham, Ɨ p<0.01 vs. LPS-CONT).

