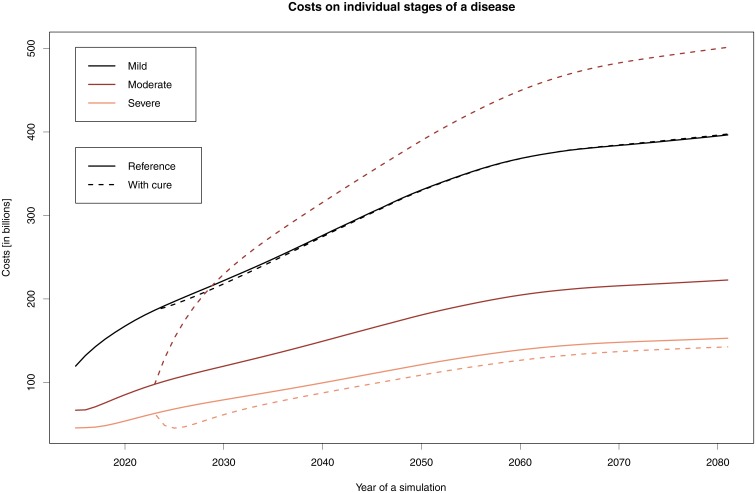
Fig 2. Cost development when staying in the Moderate stage for two more years.
The graph shows the costs associated with the individual stages: solid lines indicate the reference simulations, while dashed lines indicate the simulations where the stay in the Moderate stage is prolonged for two years.

