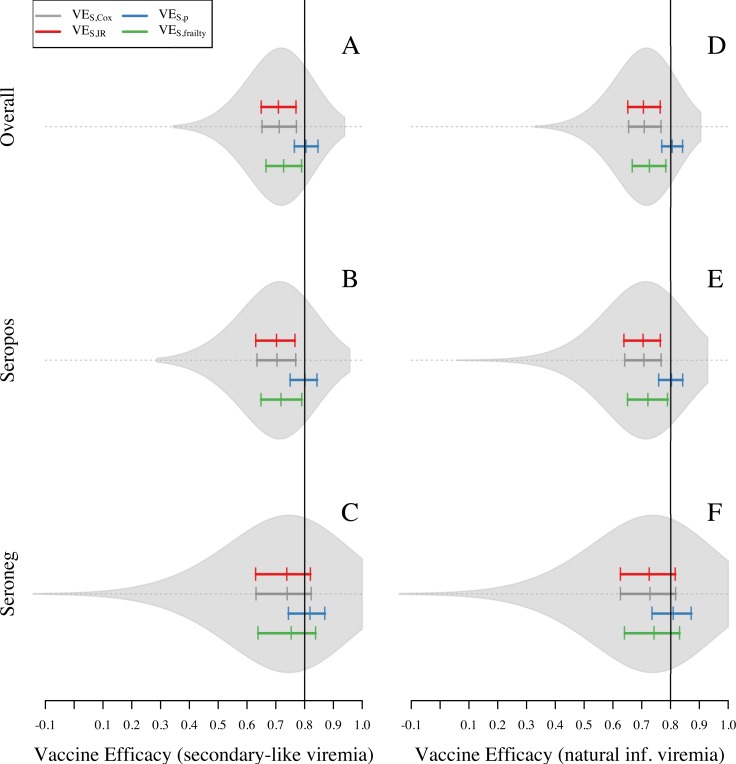
Fig 3. Overall VES and VES with stratification estimated for 1,000 simulations of the baseline scenario for one site.
In this scenario, attractiveness of humans is proportional to their body size. VES is calculated with four different methods: VES,Cox, VES,IR, VES,CI, and VES,p. Violin plots on the left panel show the shape of the distribution of VES,Cox estimates. Colored solid lines show the 25, 50, and 75 quantiles for VES,Cox, VES,p, VES,IR, and VES,frailty (gray, blue, red, and green, respectively). Black solid line represents the true PEP = 1—RRinf|exp RRdis|inf = 0.8. Left panel corresponds to the assumption of viremia in vaccinated individuals as secondary infections. Right panel corresponds to the assumption of viremia in vaccinated individuals as a natural infection.

