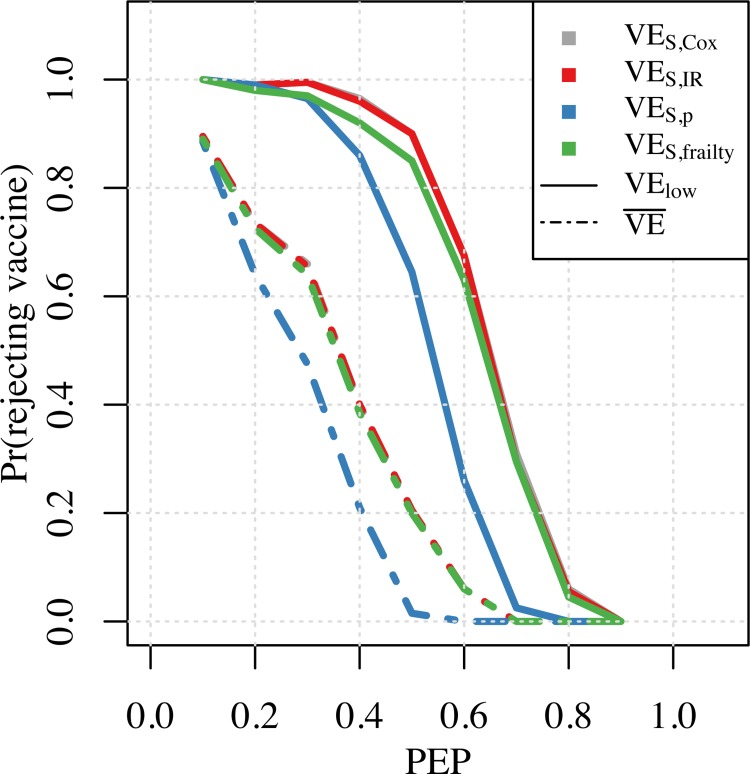
Fig 4. Probability of not licensing a vaccine with MPP = 0.3 at different input PEP values.
Solid lines represent the probability of rejection calculated as the proportion of simulations where the lower bound of the confidence interval of VES was below MPP. Dotted lines represent the probability of rejection calculated as the proportion of simulations where the mean estimate of VES was below MPP.

