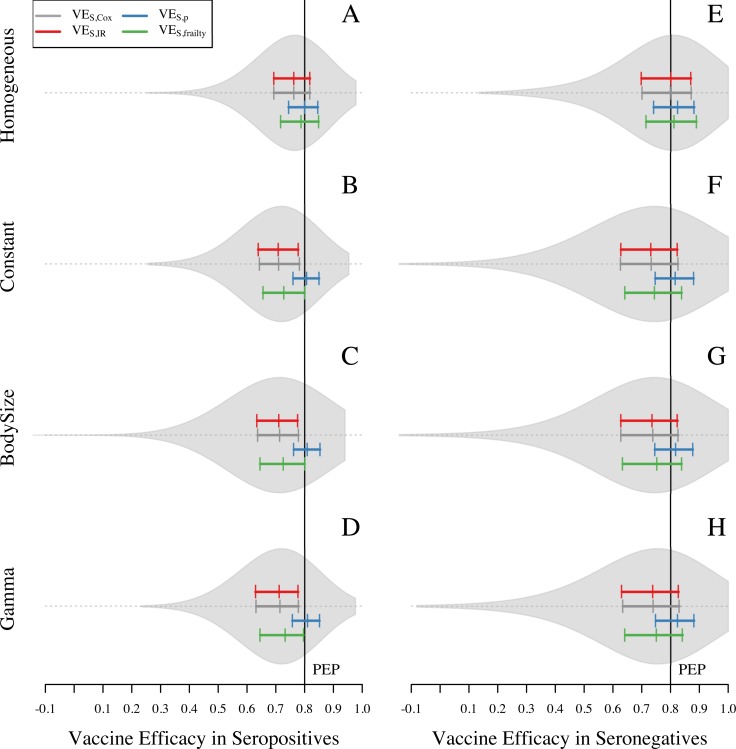
Fig 6. Vaccine efficacy in four scenarios about heterogeneous exposure to DENV for seropositive and seronegative individuals.
Violin plots show the shape of the distribution of VES,Cox estimates. The colored solid lines show the 25, 50, and 75 quantiles for VES,Cox, VES,p, VES,IR, and VES,frailty (gray, blue, red, and green, respectively). Black solid line represents the individual input of vaccine efficacy: VE = 1 –PEP = 1—RRinf|exp RRdis|inf = 0.8. The left panel corresponds to VES in seropositives and the right panel corresponds to the VES in seronegatives.

