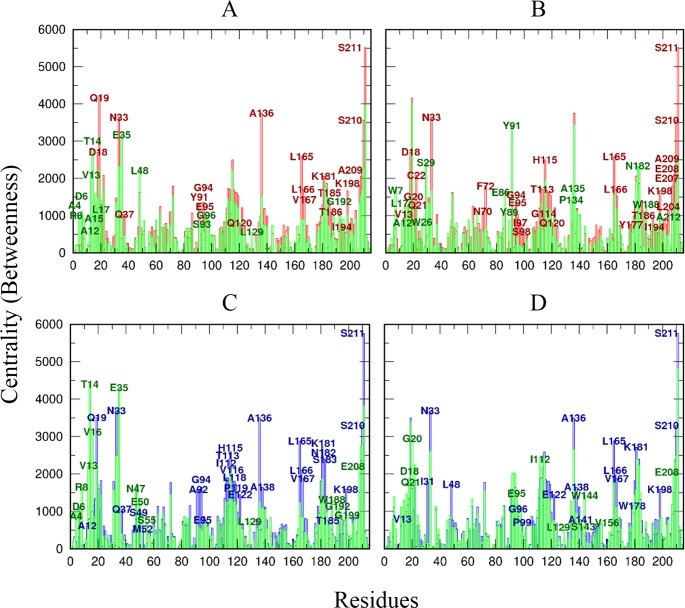
Fig 14. Residue centrality in cruzain analyzed systems.
For convenience, the centrality profiles are represented as a comparison between ligand-bound and reference systems, i. e., cruzain apo form (red lines) and cruzain-peptide complex (blue lines), and cruzain-ligand complexes (green lines): (A) cruzain-compound 1, (B) cruzain-compound 2, (C) cruzain-peptide-compound 1 and (D) cruzain-peptide-compound 2. Residues with a ΔCentrality greater than 500 are labeled with the same color of their corresponding system.

