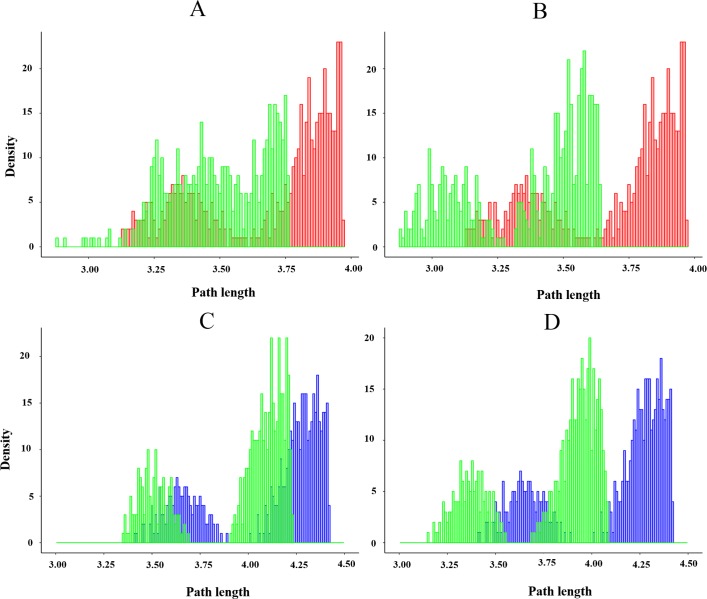
Fig 15. Statistical distribution of suboptimal paths.
The histogram of the 500 path lengths associated with the apo and holo trajectories. Histograms corresponding to (A) cruzain-compound 1 and (B) cruzain-compound 2 were compared with apo distribution (red lines), while the histograms concerning to (C) cruzain-peptide-compound 1 and (D) cruzain-peptide-compound 2 complexes were compared with that of cruzain-peptide system (blue lines).

