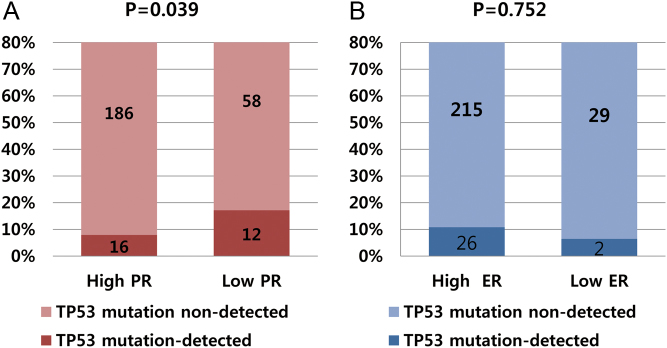
Figure 1.
TP53 mutation rates according to PR and ER status. (A) The TP53 mutation rate was significantly higher in low-PR tumors than that in high-PR tumors (17.1% vs 7.9%, P = 0.039). (B) The rates were not statistically different according to ER expression (10.8% in high-ER tumors vs 6.5% in low ER-tumors, P = 0.752).

 This work is licensed under a