Figure 1.

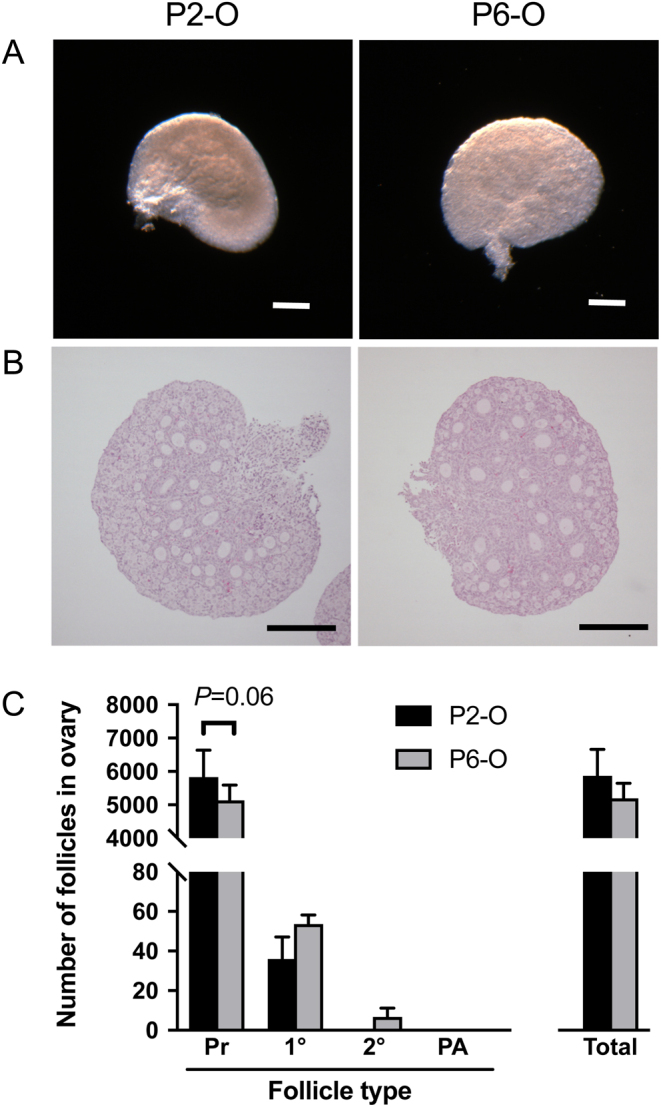
Follicle development in neonatal ovaries. Representative images of (A) neonatal ovaries and (B) central sections stained with haematoxylin and eosin. (C) The number of follicles at each stage of development and the total number of follicles were assessed in neonatal P2 and P6 ovaries. Pr, primordial follicles; 1°, primary follicles; 2°, secondary follicles; PA, preantral follicles. Scale bar: 200 µm. Data are plotted as mean ± s.d. P2-O n = 4; P6-O n = 3.

 This work is licensed under a