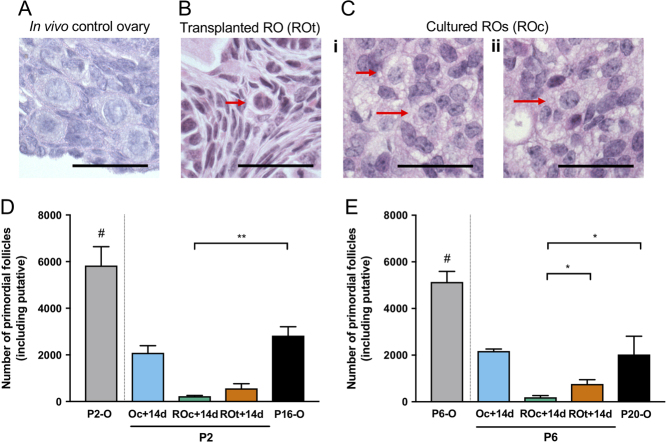
Figure 3.
Putative primordial follicles in transplanted and cultured reaggregated ovaries and primordial follicles in age-matched in vivo ovaries. Representative images of primordial follicles in (A) P16/P20 in vivo Control ovaries and putative primordial follicles in (B) reaggregated ovaries transplanted for 14 days (ROt) and (C) reaggregated ovaries cultured for 14 days (ROc) (red arrows indicate putative primordial follicles). (D) Number of primordial follicles in untreated P2 ovaries (P2-O), P2 ovaries cultured for 14 days (P2-Oc + 14d), age-matched in vivo Control of P16 ovaries (P16-O) and putative primordial follicles in P2 ROs (P2-ROc + 14d) cultured for 14 days, P2 ROs transplanted for 14 days (P2-ROt + 14d) and (E) their equivalent in P6 ovaries and ROs (P6-O, P6 + Oc + 14d, P6-ROc + 14d, P6-ROt + 14d, P20-O). #P2-O and P6-O are not compared to the other conditions, as they have not been cultured for 14 days. Data are mean values ± s.d. Scale bar: 50 µm. P2-Oc + 14 days n = 3; P2-ROc + 14d n = 5; P2-ROt + 14d n = 3; P2-ROt + 21d n = 3; P16-O n = 4; P6-Oc + 14d n = 3; P6-ROc + 14d n = 4; P6-ROt + 14d n = 3; P6-ROt + 21d n = 3; P20-O n = 3. *P ≤ 0.05; **P ≤ 0.01.

 This work is licensed under a