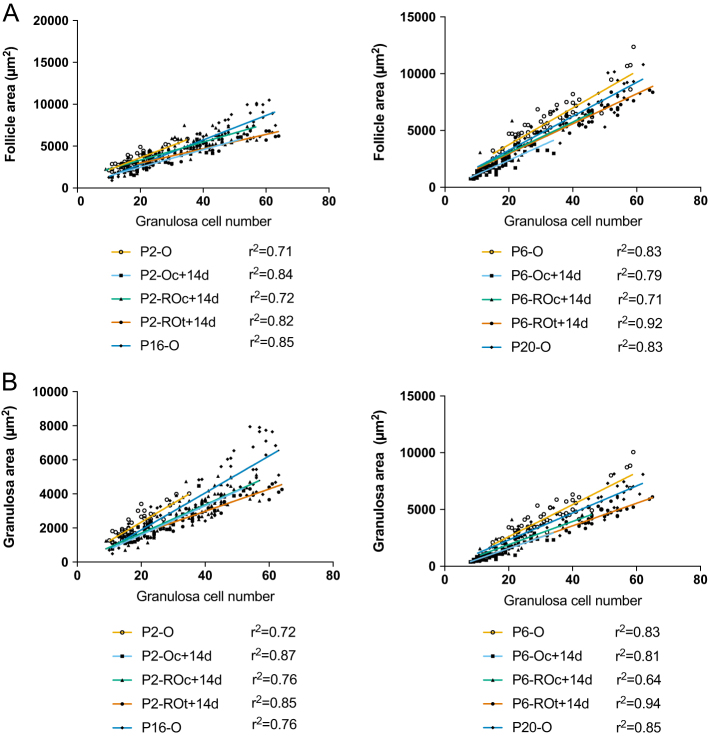
Figure 8.
Correlations between follicle and granulosa area to granulosa cell numbers in primary follicles from ovaries and reaggregated ovaries. Linear regressions were performed between (A) follicle area and granulosa cell (GC) number and (B) granulosa area and GC number in primary follicles from P2 whole ovaries (P2-O), P2 cultured ovaries (P2-Oc + 14d), P2 cultured reaggregated ovaries (P2-ROc + 14d), P2 transplanted ROs (P2-ROt + 14d) and P16 ovaries (P16-O), as well as the P6 equivalents (P6-O, P6-Oc + 14d, P6-ROc + 14d, P6-ROt + 14d, P20-O). Primary follicles: P2-O n = 49; P2-Oc + 14d n = 28; P2-ROc + 14d n = 109; P2-ROt + 14d n = 31; P16-O n = 62; P6-O n = 57; P6-Oc + 14d n = 57; P6-ROc + 14d n = 25; P6-ROt + 14d n = 44; P20-O n = 52. r 2 values are shown next to each line; all graphed lines have r 2 > 0.6. The lines graphed in follicle area to GC number (P2 group) and granulosa area to GC number (both P2 and P6 group) have significantly different gradients. The lines graphed in follicle area to GC number (P6 group) have similar gradients but differing y intercepts.

 This work is licensed under a