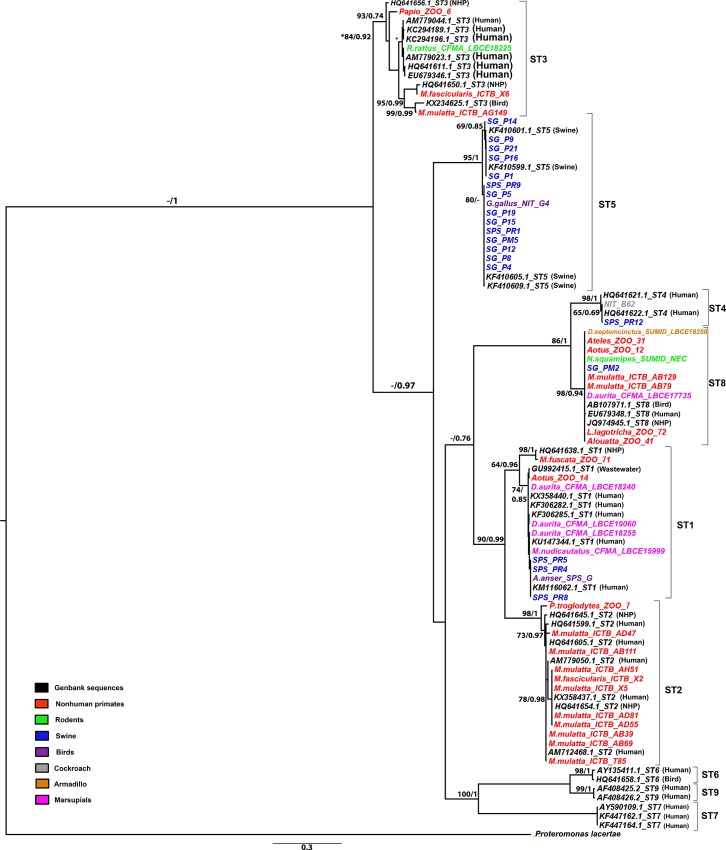
Fig 2. Maximum likelihood (ML) and Bayesian inference reconstruction tree of Blastocystis based on SSU-rDNA gene using sequences obtained in the study and Genbank retrieved.
The first number associated with each node represents the ML bootstrap value (values below 50% were not shown) followed by the Bayesian posterior probabilities. The scale bars indicate the expected number of substitutions per site.

