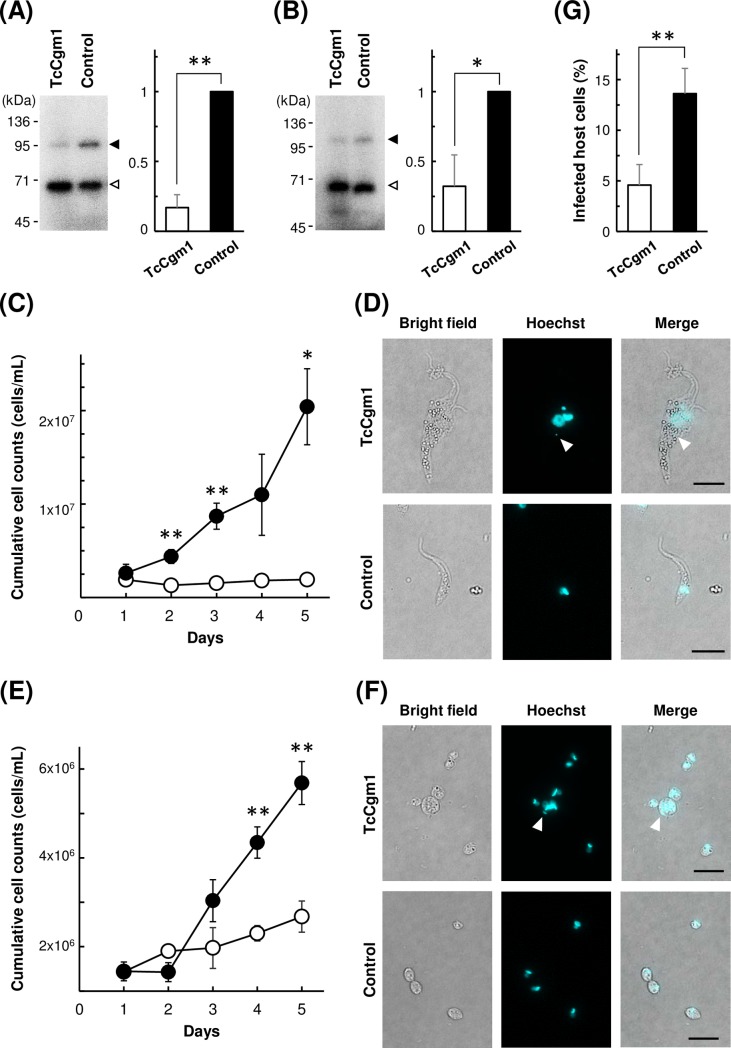
Fig 6. Phenotype of TcCGM1-knockout in epimastigote and amastigote.
(A) Guanylyltransferase assay of TcCGM1-KO epimastigote and control epimastigote cell lysates. Upper band corresponds to radiolabeled TcCgm1 (118 kDa, black arrow head) and the lower corresponds to TcCe1 (67 kDa, white arrow head). Phorphorimage of SDS-polyacrylamide gel is shown. Positions of co-electrophoresed molecular weight marker is shown on the left. The amount of [32P]-labeled target protein relative to the control level is quantitated, and the average of four guanylyltransferase assays (±SD) from two independent knockout experiments are plotted on the right (**p<0.01, paired t-test). (B) Guanylyltransferase assay of TcCGM1-KO amastigote and control amastigote cell lysates. The amount of [32P]-labeled target protein relative to the control level is quantitated, and the average of four guanylyltransferase assays from two independent knockout experiments are plotted on the right (*p<0.05, paired t-test). (C) Growth curve of Cas9-expressing epimastigote after transfection with TcCGM1-gRNA (open circle) and control gRNA (closed circle). Electroporations were performed in triplicates, and mean values (±SD) are plotted. Significant difference compared to control is indicated (**p<0.01, *p<0.05, Welch’s t-test). (D) Morphology of epimastigotes after transfection with TcCGM1-gRNA (upper panel) and control gRNA (lower panel). Images were taken at 3 days post transfection. Scale bars: 10 μm. (E) Growth curve of Cas9-expressing axenic amastigote after transfection with TcCGM1-gRNA (open circle) and control gRNA (closed circle). Electroporations were performed in triplicates, and mean values (±SD) are plotted. Significant difference compared to control was indicated (**p<0.01, Welch’s t-test). (F) Morphology of axenic amastigotes after transfection with TcCGM1-gRNA (upper panel) and control gRNA (lower panel). Images were taken at 5 days post transfection. Scale bars: 10 μm. (G) Infection efficiency of TcCGM1-KO amastigotes (white bar) and control amastigotes (black bar) to host 3T3 cells. The average of three infection experiments (±SD) are plotted (**p<0.01, Welch’s t-test).

