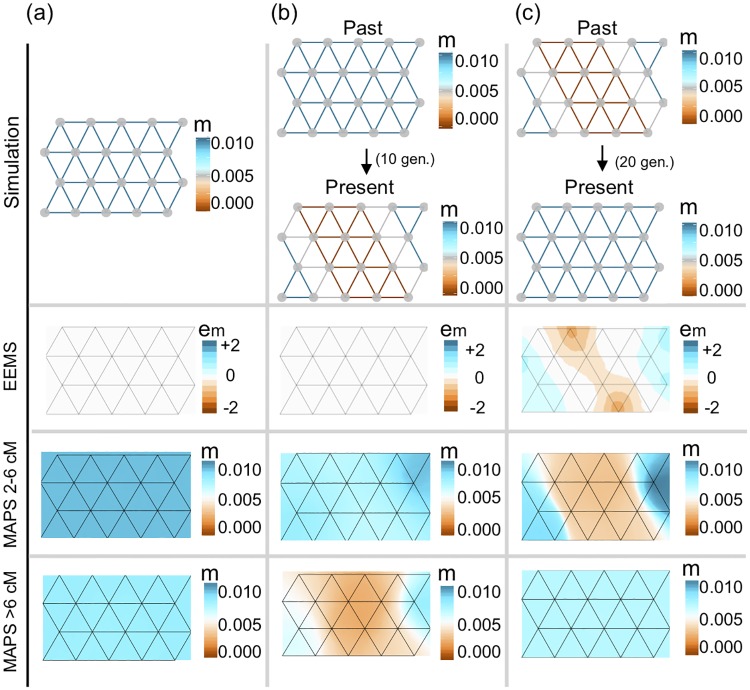
Fig 2. Simulations comparing migration rates inferred with MAPS against effective migration rates inferred with EEMS.
(a) We simulated data under uniform migration rates equal to 0.01 and applied EEMS and MAPS using PSC segments in the range 2-6cM and ≥6cM. Like EEMS, MAPS correctly infers a uniform migration surface. Additionally, MAPS provides accurate estimates of the migration rates for both PSC segments 2-6cM (mean 0.01) and PSC segments ≥6cM (mean 0.0086). (b) We simulated a recent sudden migration barrier formed 10 generations ago. Here, EEMS is unable to infer a barrier, while MAPS correctly infers the historical uniform surface (2-6cM) and a barrier in the more recent time scale (≥6cM). (c) We simulated a long-standing migration barrier that recently dissipated 20 generations ago. EEMS infers a barrier, while MAPS correctly infers both the historical migration barrier (2-6cM) and the uniform migration surface in the more recent time scale (≥6cM). In all cases shown here, we simulated a 20 deme stepping stone model such that the population sizes all equal to 10,000, and 10 diploid individuals were sampled at each deme.

