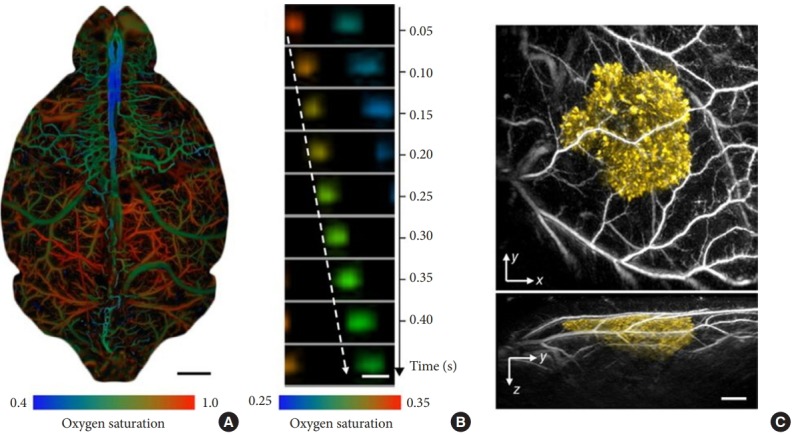
Fig. 12.

Representative in vivo photoacoustic tomography applications in life sciences. (A) Whole-cortex optical-resolution photoacoustic microscopy (OR-PAM) image of the oxygen saturation of hemoglobin in a mouse brain[52]. The arteries (shown in red) and veins (shown in blue/green) are clearly differentiated by their oxygenation levels. Blue indicates low oxygenation. Scale bar, 1 mm. (B) Sequential label-free OR-PAM images of oxygen releasing in single red blood cells (RBCs) flowing in a capillary in a mouse brain[53] Scale bar, 10 μm. Blood flows from left to right. The dashed arrow follows the trajectory of a single flowing RBC. (C) Photoacoustic computed tomography images of a tyrosinase-expressing K562 tumor (shown in yellow) after subcutaneous injection into the flank of a nude mouse[54] The surrounding blood vessels are shown in gray. Top, x-y projection image; bottom, y-z projection image. Scale bar, 1 mm.
