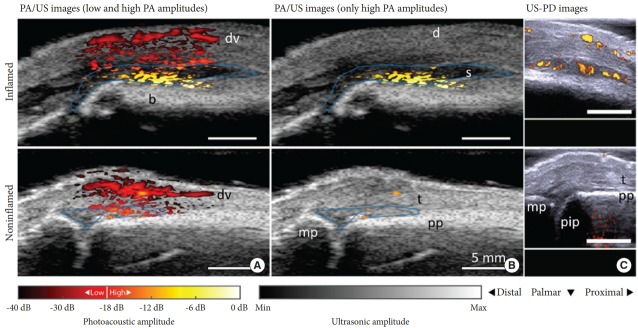
Fig. 14.
Examples of fluence-corrected photoacoustic imaging/ultrasound and US-PD images for an inflamed joint and the contra-lateral noninflamed joint. Photoacoustic imaging/ultrasound and US/PD images of an inflamed (upper row) and noninflamed contralateral joint (bottom row) of a rheumatoid arthritis (RA) patient. The photoacoustic imaging/ultrasound images in panel A show a difference in color between the inflamed and noninflamed joints corresponding to an increase in amplitude levels. When discarding the low photoacoustic amplitudes in panel B, only features in the inflamed joint are visible. The corresponding US-PD images are shown in panel C. The blue line in the PA/US images indicates the region of interest used for quantification of photoacoustic imaging features in the synovial space. The 0-dB level is the maximum photoacoustic imaging amplitude from the inflamed joint. US-PD, ultrasound power doppler; PA/US, photoacoustic/ultrasound; d, dermis; dv, dorsal vein; pp, proximal phalanx; pip, proximal interphalangeal joint; mp, middle phalanx; s, synovium; t, extensor tendon.

