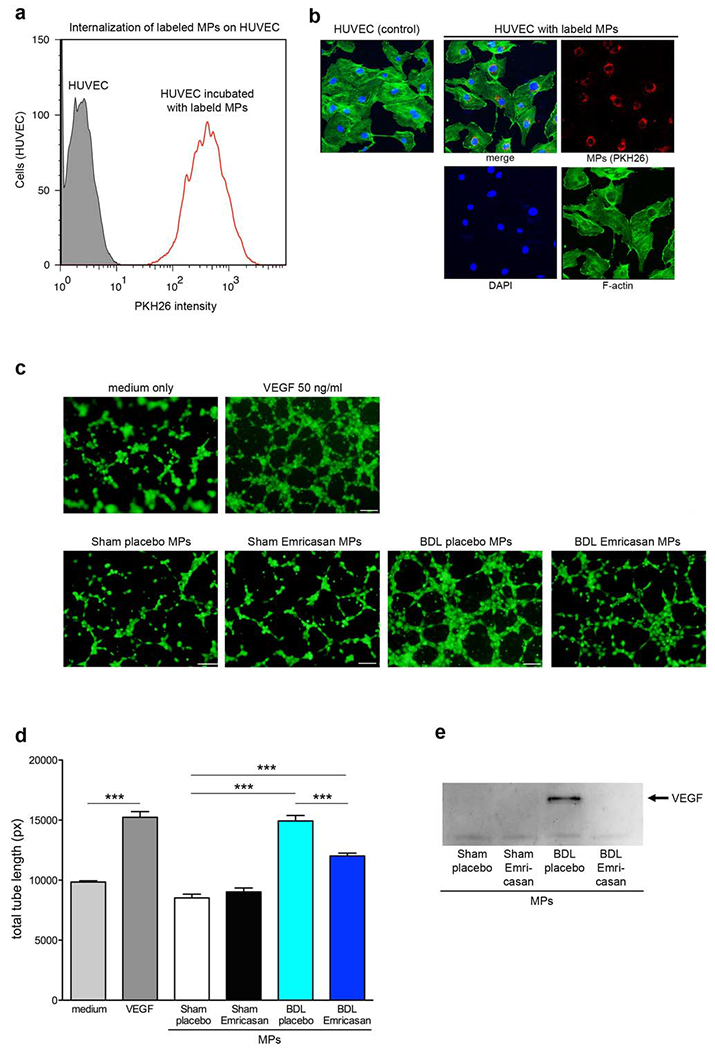
Fig. 4. Circulating MPs from short-term BDL treated with emricasan reduced endothelial cell activity.

Internalization of labeled circulating MPs on HUVEC (a) by flow cytometry or (b) by confocal microscopy. (a) The red line represents HUVECs reacted with labeled circulating MPs, whereas the gray area represents HUVECs (background control). (b) Confocal image of HUVEC incubated with PKH26 (red) labeled circulating MPs. HUVEC was stained by DAPI (blue) for nuclei and by F-actin antibody (green). (c) Microscopy image of tube formation on HUVEC stained via calcein-AM. HUVEC were treated with medium (negative control), VEGF (positive control), or circulating MPs. (d) Bar graph shows quantification of total tube length. ***p<0.001. Values are mean ± SEM. (e) Western blot analysis of VEGF levels in MPs isolated from control or BDL mice.
