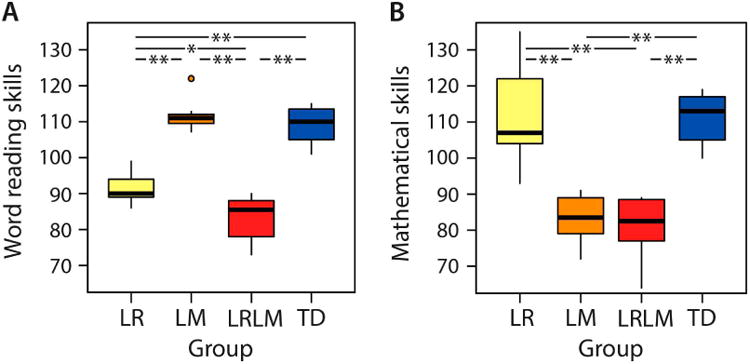
Figure 1.

Group-wise word reading skills (A) and mathematical skills (B). From left to right: Yellow bar: children with low reading ability (LR), orange bar: children with low mathematical ability (LM), red bar: children with both low reading and mathematical ability (LRLM), blue bar: typically developing (TD) children with at least average ability. Horizontal lines within the bars represent the group median. Vertical lines at the top and the bottom of the bars depict the standard deviation. Dots indicate single cases that are more than 1.5 standard deviations away from the group mean. Asterisks mark significant between-group differences (single asterisk: P < 0.005; double asterisk: P < 0.001).
