
Figure 2.
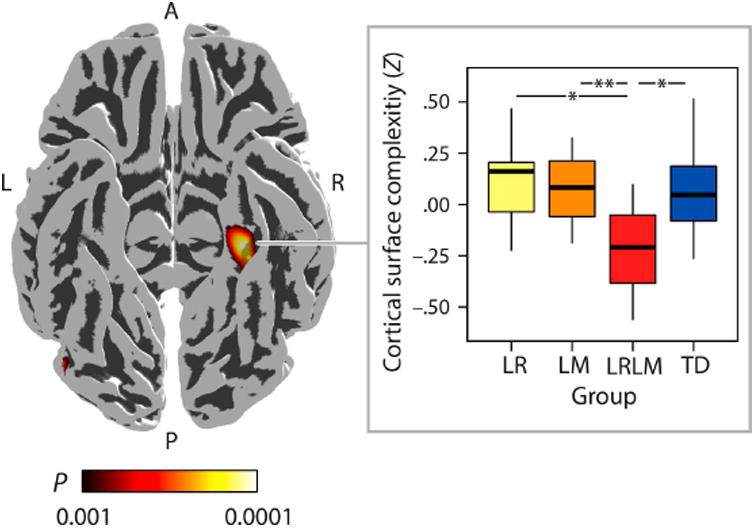
Whole-brain cortical surface complexity results. Compared to children with isolated low reading ability (LR), low mathematical ability (LM) and typically developing children (TD), children with co-occurring difficulties (LRLM) showed significantly reduced cortical surface folding of the right parahippocampal gyrus (MNI coordinates: +33 −39 −12; 511 vertices). L = left, R = right, A = anterior, P = posterior. The color bar illustrates the P-values of the T-contrast (+LR +LM −LRLM +TD) that was thresholded at height P < 0.001 with false-discovery-rate (FDR) corrections at a spatial extent threshold of P < 0.05. Effect sizes at each vertex yielded Cohen's D > 0.8. Group-wise medians (horizontal lines within the bars) and standard deviations (vertical lines at the top and the bottom of the bars) of the cortical surface complexity (Z scores) within the cluster are visualized in the boxplot. From left to right: Yellow bar: children with low reading ability (LR), orange bar: children with low mathematical ability (LM), red bar: children with both low reading and mathematical ability, blue bar: typically developing (TD) children. Asterisks mark significant between-group differences (single asterisk: P < 0.005; double asterisk: P < 0.001).