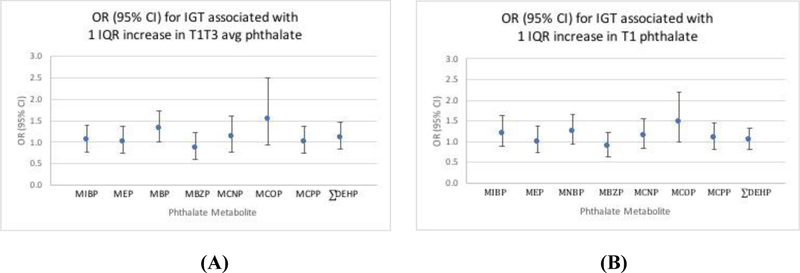
Figure 2: Phthalates in association with IGT.
Adjusted odds ratio (OR) and 95% confidence interval (95% CI) for the association between one interquartile range (IQR) increase in phthalate and IGT.1 A) T1T3avg phthalate metabolite; B) T1 phthalate metabolite
1 Model adjusted for maternal age, maternal BMI, study center, race/ethnicity, parity, and gestational age at glucose testing

