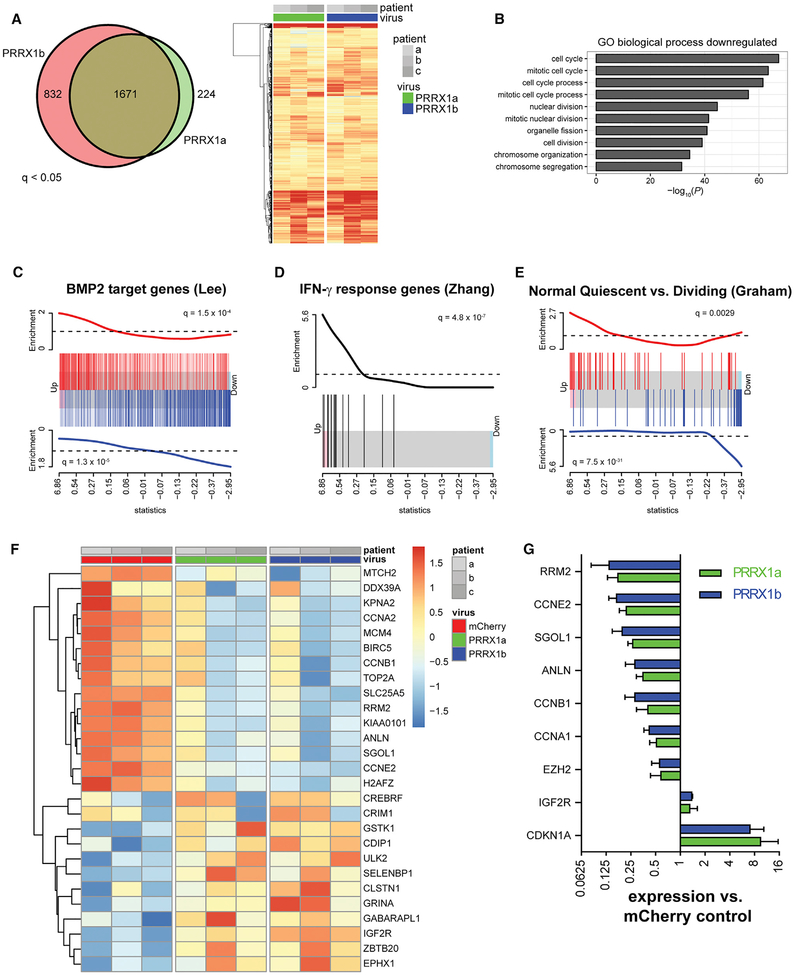
Figure 5. PRRX1 Overexpression Induces a Gene Signature Associated with Quiescence.
RNA-seq analysis was performed 48 hr after infection with PRRX1 or mCherry LV (n = 3 individual patient samples).
(A) Differential gene expression analysis identified >1,500 genes upregulated compared to mCherry hOPCs (q < 0.05). Venn diagram shows the high extent of overlap between genes upregulated between PRRX1a and PRRX1b. Likewise, the heatmap of all upregulated genes reflects strong correlation between PRRX1a and PRRX1b transcriptional responses (expression relative to matched mCherry-infected hOPCs; increasing intensity of red indicates upregulation).
(B) Gene ontology-based over-representation analysis revealed that cell-cycle-related biological process terms were significantly downregulated in response to PRRX1 overexpression.
(C–E) Gene set enrichment analysis showed coordinated regulation of transcripts associated with BMP2 (C), IFN-γ (D), and quiescence (E). Barcode plots are shown, and the x axis is the rank order of hOPC genes by the F-test statistic in response to PRRX1a expression. Red bars indicate the position of upregulated genes, and blue bars indicate the downregulated genes in each gene set. The red and blue traces above and below show relative enrichment of up- and downregulated genes, respectively (q value is shown).
(F) Heatmap of significantly regulated genes associated with the stem cell quiescence signature (Cheung and Rando, 2013). Scale indicates expression relative to median level across RNA samples.
(G) qPCR of cell-cycle genes following PRRX1 infection (mean ± SEM, n = 3).

