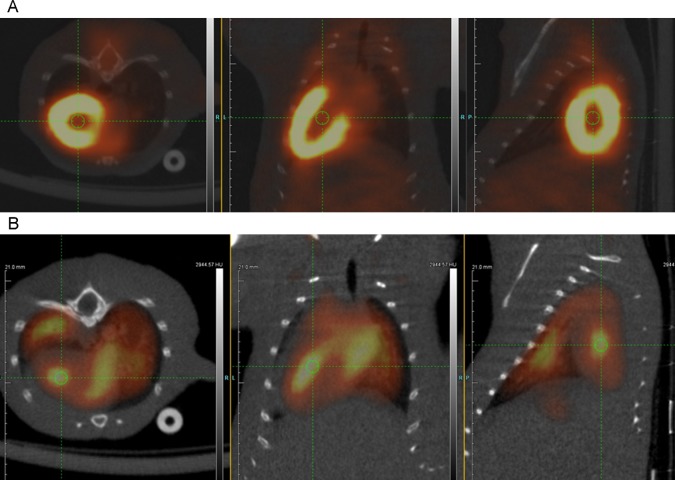
Fig 4. Fused PET/CT images of thorax of control FDG injected mouse and mouse injected with FDG-labeled human erythrocytes.
(A) Axial (left), coronal (middle), and sagittal (right) fused microPET/CT images of the mouse thorax show intense physiologic FDG uptake by the myocardium of the left ventricle in a splenectomized NSG mouse injected with 2.2 MBq of free FDG. Green circle indicates lumen of the left ventricle. (B) Axial (left), coronal (middle), and sagittal (right) fused microPET/CT images of the mouse thorax show FDG activity within the lumen of the cardiac chambers (green circles) in a splenectomized NSG mouse injected with 1.7 MBq of FDG-labeled human erythrocytes. Pulmonary perfusion about the heart is also visualized.

