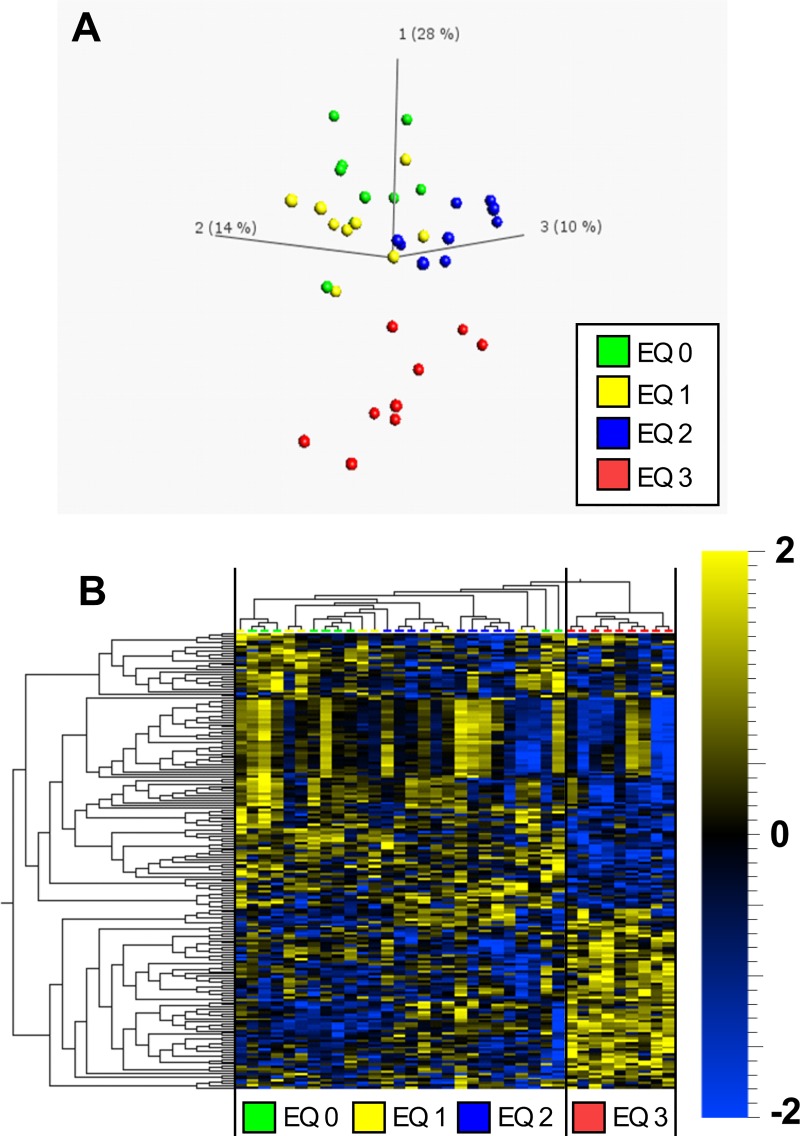
Fig 1. Principal component analysis (PCA) and hierarchical clustering analysis (HCA) of 192 significantly regulated (p<0.05, ANOVA) metabolites in livers of Atlantic salmon (Salmo salar L.) exposed to graded levels of ethoxyquin (EQ) through their diet for 90 days.
Differential analysis (ANOVA), PCA (A) and HCA (B) were performed using the Qlucore omics-explorer. The heatmap (B) represents the concentrations of significantly affected metabolites within each measured sample (represented in the columns). Yellow bars indicate higher concentrations of a metabolite, while blue bars indicate lower concentrations of a metabolite, on a scale from -2 to 2, where 1 unit is equal to a variance of 1 from the mean. See S2 Table for a complete overview of individual metabolites.

