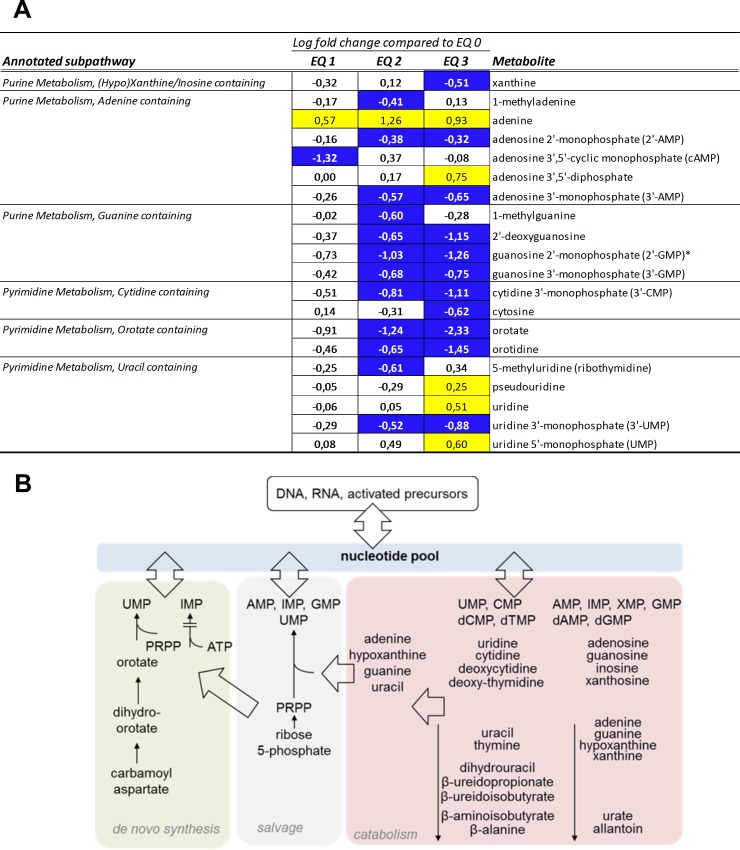
Fig 5. Alterations in purine and pyrimidine metabolism in livers of Atlantic salmon (Salmo salar L.) exposed to graded levels of ethoxyquin (EQ) through their diet for 90 days.
(A) Metabolites displaying differential expression (p<0.05, ANOVA) were grouped according to subpathway annotations. Scaled intensity means were used to calculate log2 fold changes in the individual exposure groups compared to unexposed control animals (EQ 0). Significance of change was analyzed through pairwise comparisons between the individual exposure groups and the control, with colors denoting a significantly (p<0.05) increased (yellow) or decreased (blue) levels compared to the control. See S4 Table for a complete overview of individual metabolites. (B) Overview of nucleotide metabolites within the pathways of nucleotide synthesis, salvage, and catabolism.

