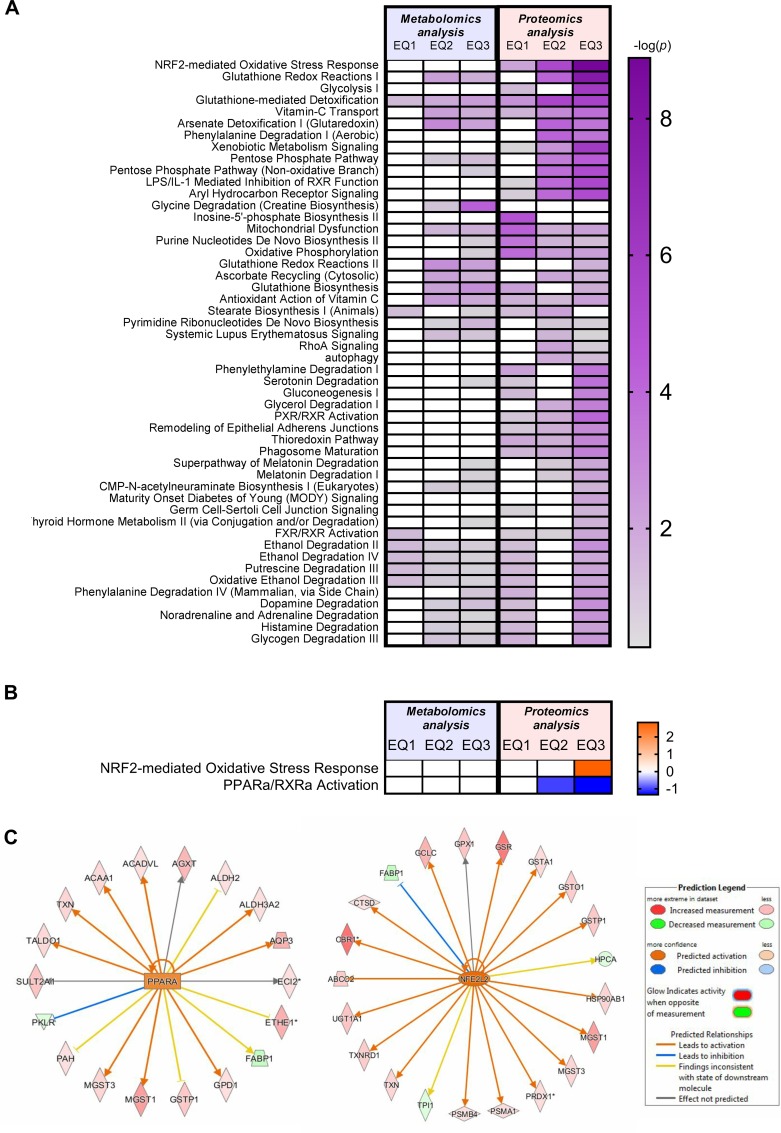
Fig 8. Canonical pathway and upstream regulator analyses of metabolites and proteins in Atlantic salmon (Salmo salar L.) exposed to graded levels of ethoxyquin (EQ) through their diet for 90 days.
(A) Significantly regulated (p<0.05, ANOVA) metabolites and proteins in liver subjected to Ingenuity Pathway Analysis (IPA). Statistical significance of overrepresentation of metabolites and proteins in different “canonical pathways” is shown as a heat-map. The top 50 of only selected pathways that obtained a significant (p<0.05, Fisher’s exact test) enrichment score (-log10 p-value) in at least one of the exposure conditions and were associated with at least two molecules are shown. Scores above the cut-off (1.3) are displayed by a color gradient. Scores below the cut off value are displayed as white boxes. Matching expression patterns of proteins significantly affected in salmon livers after 90 days dietary EQ treatment identified activation (orange) or inhibition (blue) of two canonical pathways (B) and highlighted an activation (orange) of NFE2L2 and PPARA as likely affected upstream regulators (C) independent of the overlap p-value using the activation z-score. The full data-set including metabolites and proteins in each pathway, the complete list of significant pathways as well as a complete list of predicted upstream regulators are presented in S5A and S10A Tables, and S5D and S10D Tables, respectively.

