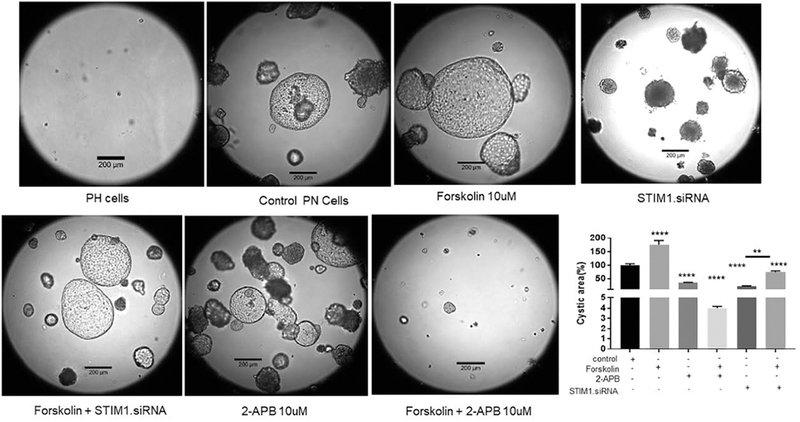
Figure 3: Cysts growth in pkd1−/− mouse derived proximal tubule cells.

Cells were treated with Control (opti-MEM), Lipo –control (transfection reagent control), RNA control, STIM1 siRNA 3nM. SiRNA treated once on Day 11. Pics were taken on Day 18th. Columns represent mean ± SEM (n=6-10). Average cyst from control group was considered 100%, and the rest of the cysts were compared with this cyst.**P<0.01, ****P<0.0001.
