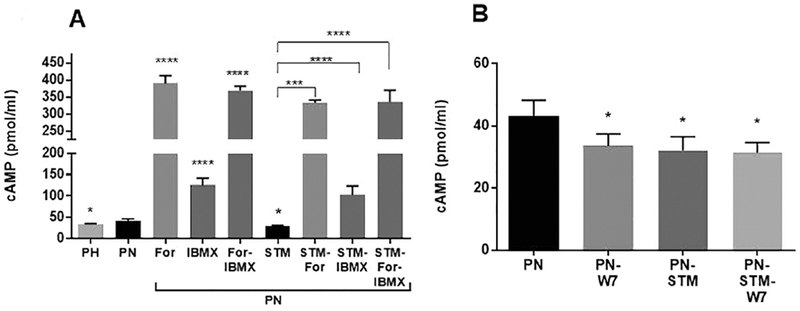
Figure 8. Steady State Levels of cAMP:

A) At day five confluent cells were treated with Forskolin (100μ M) or IBMX (100μ M) for 30min before harvesting the cells for assay. Cyclic AMP levels were measured with a direct cAMP Enzyme immunoassay Kit based on the manufacturer’s protocol. Results are expressed as pmole/ml. Columns represent averages ± SEs. *P < 0.05, ***P<0.001, ****P<0 0001. Statistical analysis was performed using a 2-tailed Student t-test. n=3-6: Note that forskolin causes a large increase in cAMP. A smaller increase occurs with IBMX. However, the increase induced by forskolin alone is similar to that of IBMX plus forskolin. STIM1 silencing reduces the levels of cAMP compared to untreated PN cells. Forskolin and IBMX increase cAMP to a lesser extent when STIM1 is knocked down. B): At day four confluent cells were treated with W7 (50uM) for 16h. Note that both STIM1 knockdown and W7 treatment reduced cAMP levels about the same amount. Treating cells with W7 when STIM1 is silenced abolishes the W7 effect indicating that both are working via a common pathway.
