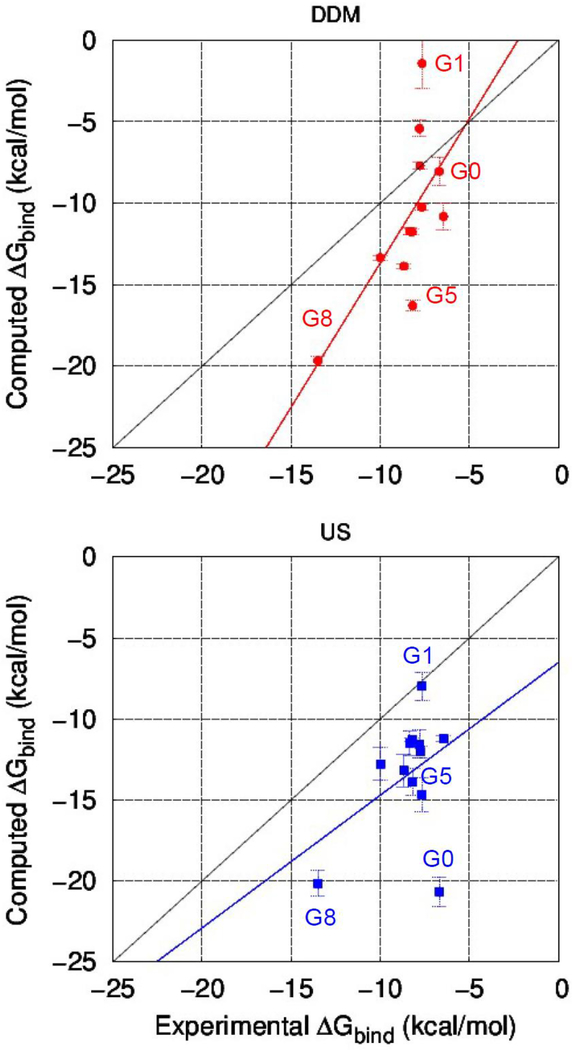
Fig. 7.
Correlations between experimental and computed free energies using method 1 (DDM) (top) and method 2 (US method) (bottom). Computed values are presented as the mean and standard error (error bar) with linear regression line; red for double decoupling method and blue for umbrella sampling method. Solid black line denotes a perfect positive correlation. G12 and G13 are not included.

