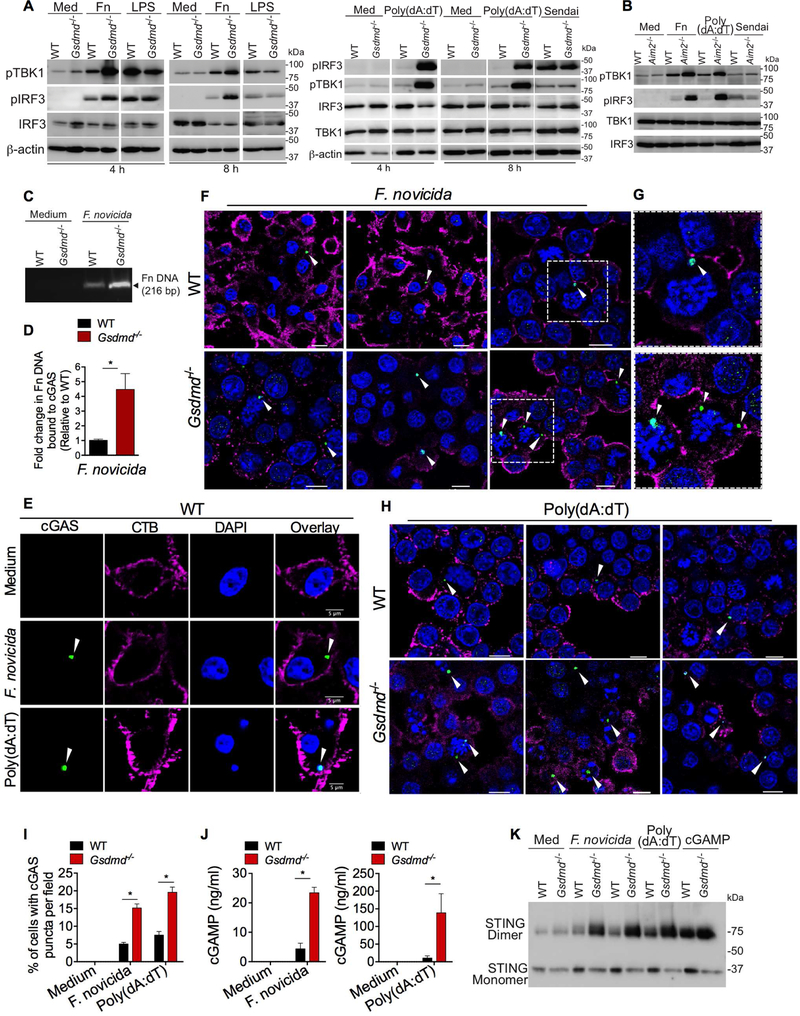
Figure 3. Gasdermin D suppresses cytosolic DNA-induced IFN-β by targeting cGAS.
(A) Immunoblots of pIRF3, pTBK1, IRF3, TBK1, and β-actin in the lysates of WT and Gsdmd−/− BMDMs stimulated with indicated treatments for indicated times. Med, medium; Fn, F. novicida.
(B) Immunoblots of pIRF3, pTBK1, IRF3, and TBK1 in the lysates of WT and Aim2−/− BMDMs stimulated with indicated treatments for 8 h.
(C-D) PCR analysis of F. novicida DNA recovered from cGAS immunoprecipitates from WT and Gsdmd−/− BMDMs stimulated with F. novicida for 6 h. Agarose gel image of PCR products (C). Fold increase in cGAS-associated F. novicida DNA in Gsdmd−/− BMDMs over that of wild-type BMDMs as revealed by quantitative PCR (D). Fn, F. novicida.
(E-I) Confocal images of WT and Gsdmd−/− BMDMs stimulated with F. novicida or poly(dA:dT) for 5 h. Cells were stained with an antibody for cGAS (green), cholera toxin B for plasma membrane (magenta), and DAPI for nucleus and DNA (blue) (E-H). Arrowheads indicate cGAS puncta. Three different fields per genotype for F. novicida and poly(dA:dT) stimulations are shown in F and H, respectively (merged images). Enlarged images of the boxed areas in F are shown in G. Quantification was done by counting the cells containing cytosolic cGAS puncta in 30 fields with approximately 20 cells each (I). Scale bar, 5 μM (E) or 10 μM (F and H).
(J) cGAMP amounts in WT and Gsdmd−/− BMDMs stimulated with F. novicida or poly(dA:dT) for 5 h as measured by LC-MS.
(K) STING monomers and dimers in the lysates of WT and Gsdmd−/− BMDMs stimulated with F. novicida (MOIs of 50 and 100), poly(dA:dT), or cGAMP for 6 h as assessed by nonreducing PAGE and immunoblotting. Med, medium.
Combined data from three independent experiments are shown as mean ± SEM. *, P <0.05; unpaired two-tailed t test (D) or two-way ANOVA followed by the Sidak’s post-test (I and J). Scale represents 5 μM (E) or 10 μM (F and H). See also Figure S2.

