
Figure 7.
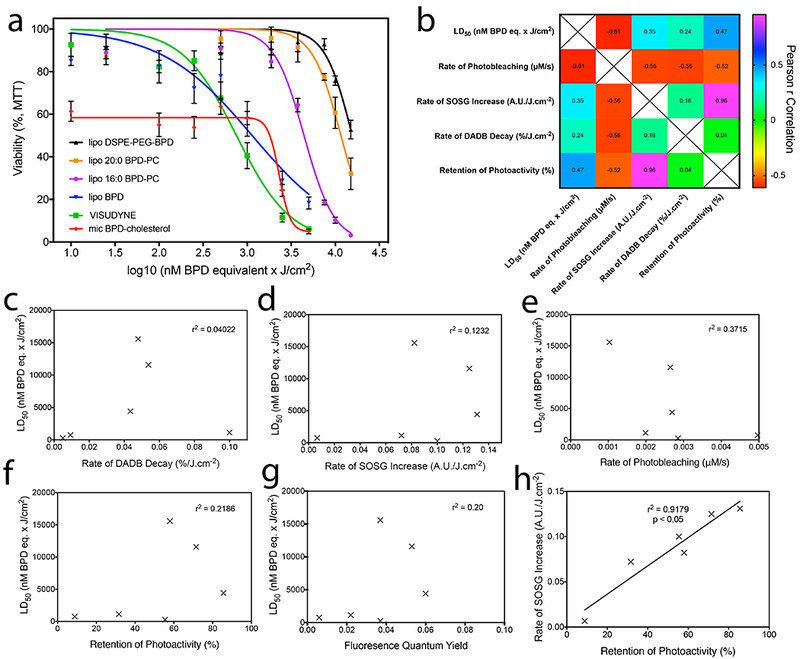
a) Survival curves of OVCAR-5 cells obtained using the MTT viability assay 72h following PDT with varying fluences of 690 nm light at an irradiance of 150 mW/cm2 to deliver PDT dose products of 10 – 15,000 nM BPD equivalent × J/cm2. b) Pearson’s r correlation matrix of nanolipid formulation LD50 values in OVCAR-5 cells with their respective photochemical and photophysical properties. Individual plots are represented for LD50 values with rates of DADB decay (c), rate of SOSG increase (d), rate of photobleaching (e), degree of retention of photoactivity (f), and fluorescence quantum yield (g). The only statistically significant correlation exists between the degree of retention of photoactivity and rate of SOSG increase (h, r2 = 0.9179, p<0.05).