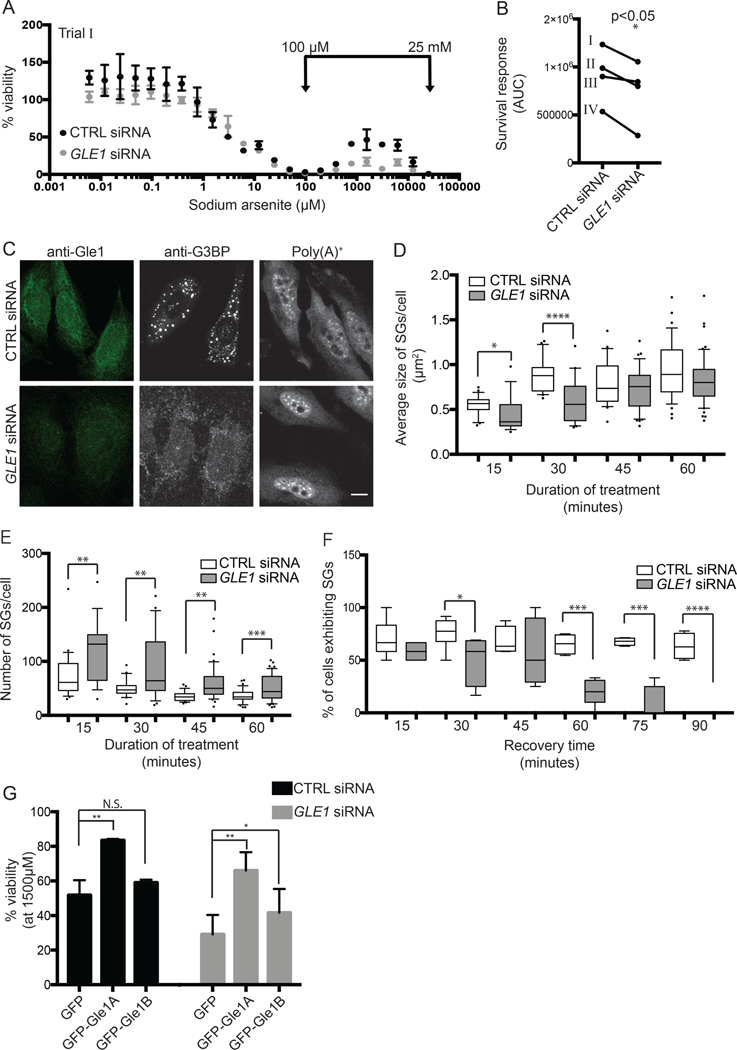
Figure 2. Gle1 is required for survival response.

(A) Dose response curves of sodium arsenite on cell viability were assessed for nontargeting (CTRL) or GLE1 siRNA-treated HeLa cells exposed to 6 nM to 25 mM arsenite for 72 hours. Representative viability curves are shown, where each data point represents the average of 2 technical replicates normalized to duplicate untreated wells. Error bars denote range. (B) The sodium arsenite survival response was quantified as described, and plotted for four independent trials. Data shown in (A) is indicated in (B) as “Trial I”. (C) SG formation and mRNA export were evaluated in CTRL or GLE1 siRNA-treated HeLa cells exposed to 500 μM sodium arsenite for 1 hour. SGs were detected by anti-G3BP indirect immunofluorescence, and poly(A)+ localization was determined by in situ hybridization to Cy3-oligo dT. Scale bar represents 10 μm. (D, E) Size and number of SGs were determined for CTRL and GLE1 siRNA-treated HeLa cells after 500 μM sodium arsenite treatment 15 to 60 minutes. G3BP immunofluorescence was quantified using ImageJ 3D objects counter, where surface areas of 3D objects was reported. Data was collected at each time point for three independent experiments, and plotted onto a box and whiskers graph where whiskers denote 10th-90th percentile of data. (F) The percentage of cells exhibiting SGs was monitored over recovery time following 500 μM sodium arsenite treatment for 1 hour. SG-positive cells were quantified at each time point for three independent experiments, and plotted onto a box and whiskers graph. (G) Survival response to 1500 μM sodium arsenite for 72 hours was assessed in CTRL or GLE1 siRNA-treated HeLa cells exogenously expressing GFP, GFP-Gle1A or GFP-Gle1B. *p<0.05; **p<0.01; ***p<0.001; statistical significance was determined by Student’s paired t-test.
