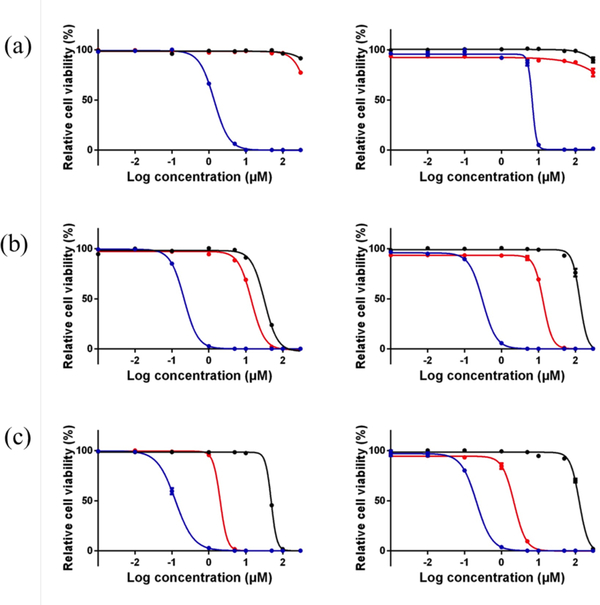
Figure 3.
In vitro dose–response curves for compounds 1 (a), 2 (b), and 3 (c) in SK-MEL-28 cells (left) and HL-60 cells (right). Treatment conditions were dark (black), broadband visible light (blue), or single-wavelength red light at 625 nm (red). Light treatments were 100 J cm−2 delivered at a rate of approximately 28 mW cm−2.

