Figure 3.
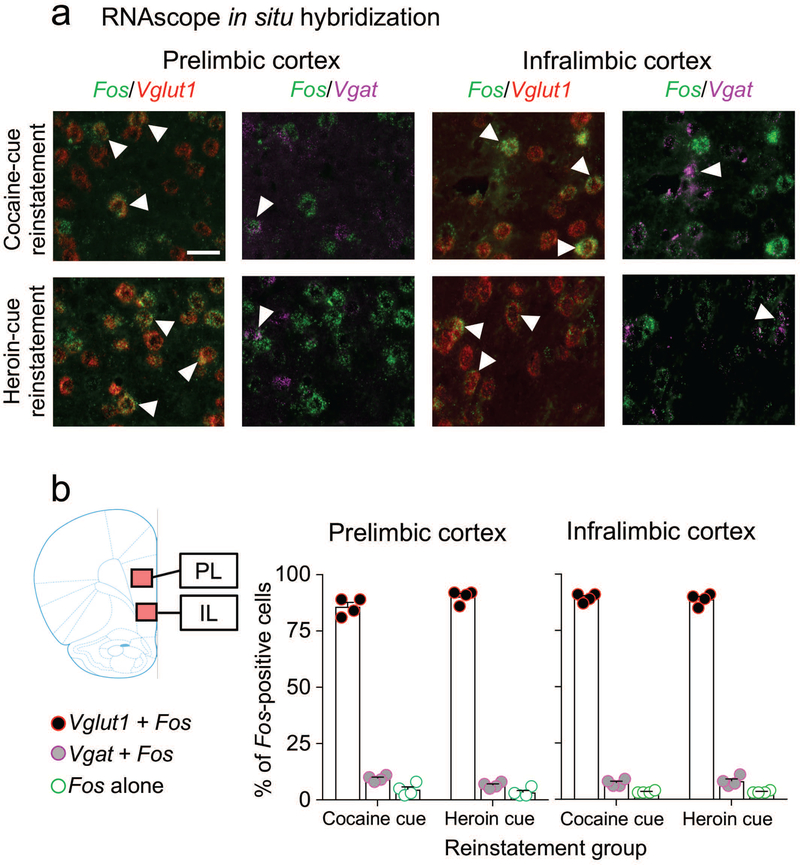
Cellular phenotypes of Fos-positive neurons in mPFC after cue-induced reinstatement of cocaine or heroin seeking. (a) Triplex detection of Fos (green), Vglut1 (red), and Vgat (purple) mRNAs in PL and IL cortex after cue-induced reinstatement of cocaine or heroin seeking. Representative images of selected cells (Fos-positive, white arrows). Images on the left (Vglut1 + Fos) for each subregion show merged channels for Fos (green) and Vglut1 (red) signals. Images on the right (Vgat + Fos) for each subregion show the merged channels for Fos (green) and Vgat (purple) from the same brain sections and fields than the left side. (b) Graphs indicating the percentage of Fos-positive neurons (n = 8 rats, 4 per cue condition) that coexpressed Vglut1 (Vglut1 + Fos) or Vgat (Vgat + Fos) mRNA in the PL or IL subregions of the mPFC. A small number of Fos-positive neurons did not coexpress either Vglut1 or Vgat mRNA (Fos alone). Images of PL and IL were captured from the areas indicated in the coronal section schematic drawing. Fos-positive nuclei were quantified from the entire captured image indicated by the colored overlays. Scale bar is 30 μm.

