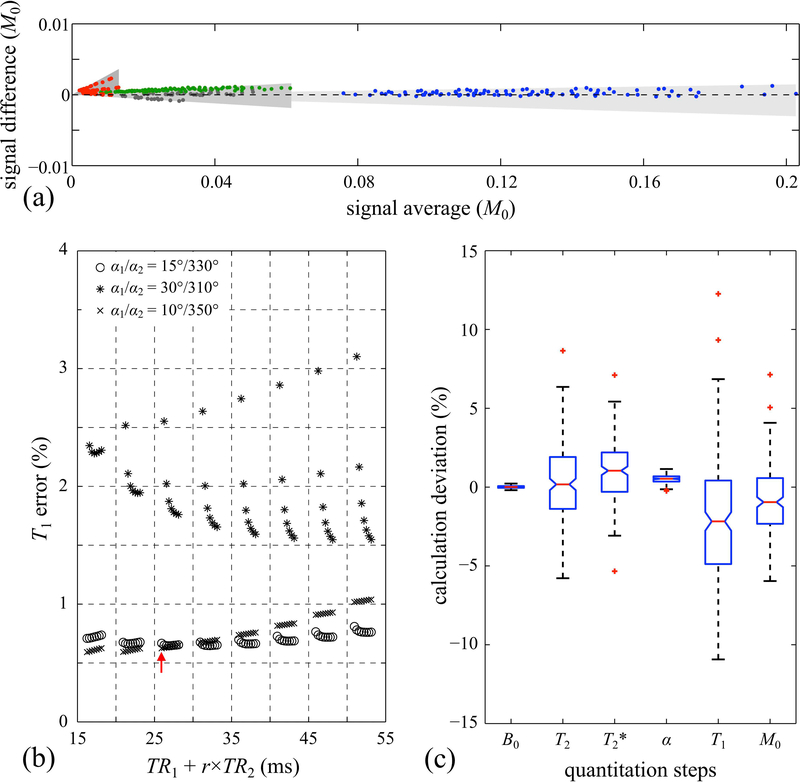
Fig. 3.
: (a) Signals acquired and spatially-averaged over an fBIRN gel phantom were compared in a Bland-Altman manner with corresponding MPME simulations. Overall, the good agreement between simulated and sampled MPME data was interpreted as validation of the simulation. Red, gray, blue, and green circles represent data from the −2nd, −1st, 0th, and 1st pathways, respectively. Gray shaded areas were drawn to show the effect of varying the simulated flip angle from −1% to +1% of the nominal values. In (b), simulated MPME with added noise were converted into T1 estimates, for a number of different TR1, TR2, α1 and α2 settings. A solution was sought that would lead to relatively small T1 errors and relatively short scan times. The red arrow points to the practical solution selected here for in vivo scans. The parameter r represents the ratio in matrix size between scans i=2 and i=1, which is 1/16 here, such that (TR1+r×TR2) as plotted on the horizontal axis is proportional to total scan time. (c) Deviations from the ground truth at each quantitation step were simulated and are displayed in a box-and-whisker plot, showing how noise propagates from one processing step to the next. Red ‘+’ markers, whiskers and boxes indicate, respectively, outliers, min/max values, and the 1st and 3rd quartiles.

