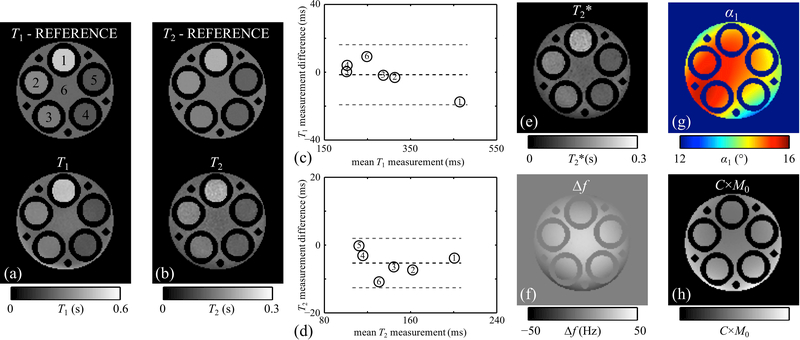
Fig. 4.
: (a,b) T1 and T2 maps derived from spin-echo data were compared to those obtained with the proposed approach, for a given 2D slice in a custom-made multi-compartment gelatin phantom. (c,d) Agreement was tested using Bland-Altman plots. Black and gray dashed lines represent the bias and limits of agreement, respectively. (e-h) Quantitative maps of T2*, offset frequency, flip angle and sensitivity-weighted proton density were also reconstructed, using the proposed methodology.

