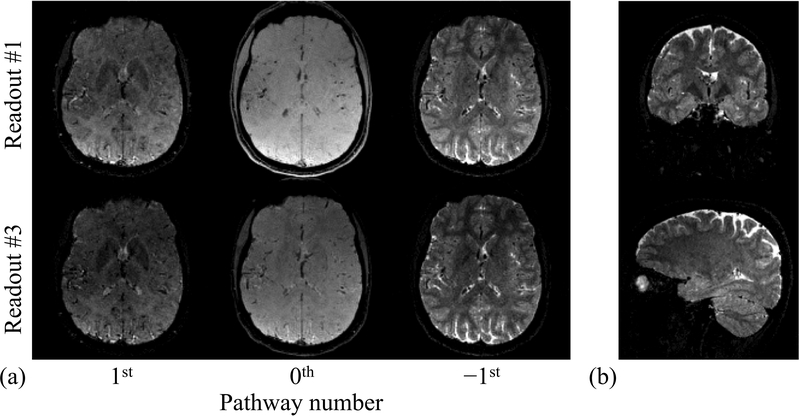
Fig. 5.
: Images are shown for three different pathways at two different echo times, for one axial slice (out of 160) and one subject (out of 5). These images provide drastically different tissue contrasts, allowing the present method to function. In (b), images that correspond to the 2nd readout (out of 3) of the −1st pathway are shown, in coronal and sagittal views.

