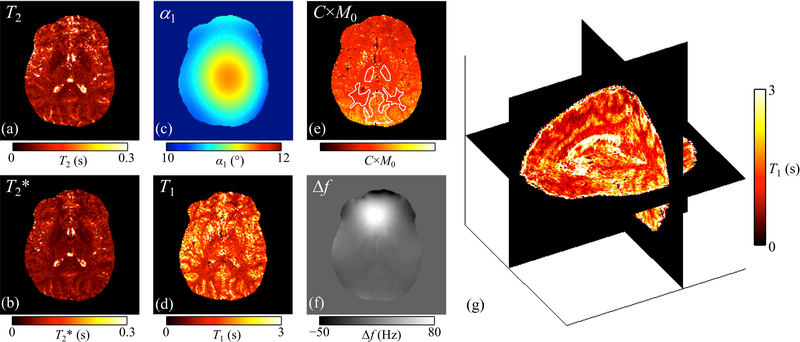
Fig. 6.
: (a-f) Reconstructed parameter maps are shown, for one given slice from one given subject (subject #1). The slice shown here was further involved in the Bland-Altman validation process in Fig. 7. More specifically, this slice was further imaged with 2D spin-echo and gradient-echo sequences, and the ROIs used for validation are shown in (e), overlaid on the C×M0 map using white contours. A 3-plane visualization of the whole-brain T1 map is shown in (g) to emphasize the 3D nature of the reconstructed results.

