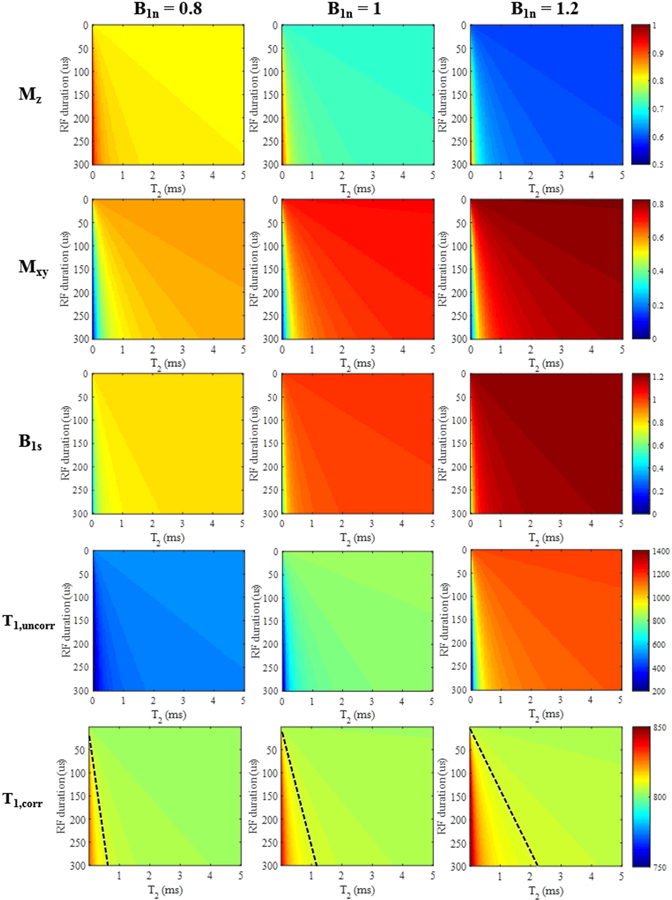
Figure 2.

Simulation results for different T2 tissues (T2 values from 0 to 5 ms) with rectangular RF pulse excitation (durations from 0.1 to 300 μs). The top two rows show color maps corresponding to the longitudinal ( or ) and transverse ( or ) magnetizations calculated from Eqs. [3] and [4]. The third row shows the resulting B1s scaling factors obtained by the AFI method (i.e. Eqs. [7] and [8]). T1 values (units of ms) generated by the VFA method are shown without (fourth row) and with B1s correction (fifth row). For the B1-corrected T1 results, a dashed black line was drawn such that the region to the left of the line had a T1 estimation error greater than 1% and the region to the right had an estimation error less than 1%. The columns represent simulation results with nominal B1 scaling factors B1n of 0.8, 1, and 1.2, respectively.
