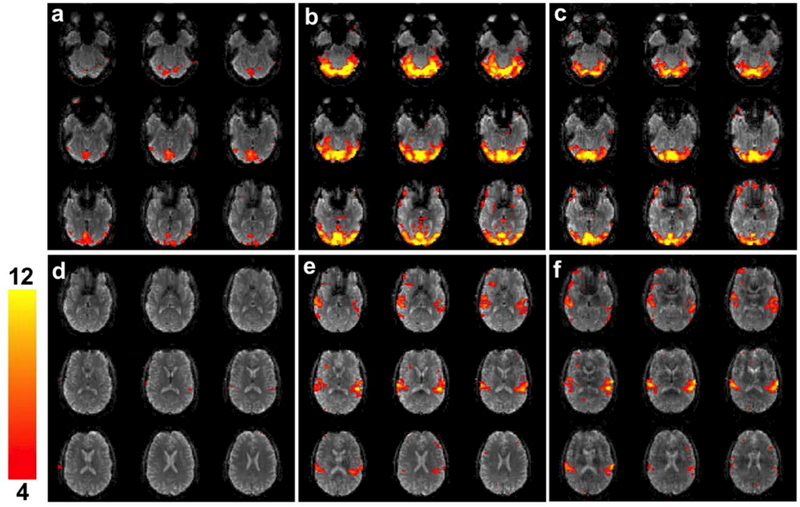
FIG. 10.

Figures (a)-(c) show visual activation in nine slices for R = 1, 4, and 8 3D blipped-CAIPI CEPI overlaid on the mean image for a single subject. The activation was windowed between t = 4 to 12. Similarly figures (d)-(f) show the audio activation in nine slices for R = 1, 4, and 8 overlaid on the mean image.
