FIG. 5.

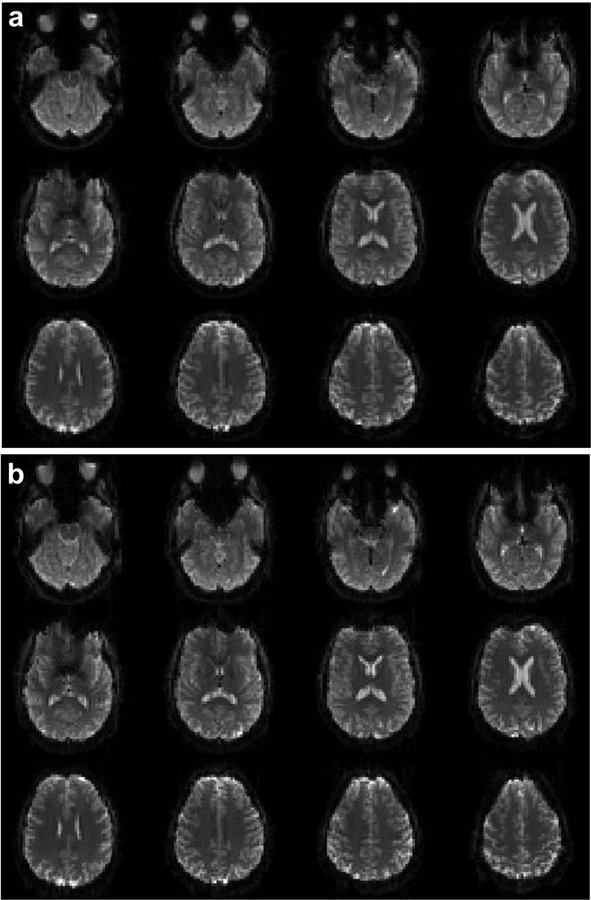
Comparison of images acquired using CEPI (a) and EPI (b) sequences. The x and y gradients and trajectories are shown in Figs. 1 (a) and (b) by the blue and red lines respectively. The images are windowed identically.

Comparison of images acquired using CEPI (a) and EPI (b) sequences. The x and y gradients and trajectories are shown in Figs. 1 (a) and (b) by the blue and red lines respectively. The images are windowed identically.